
TL;DR:
- Business intelligence transforms raw business data into actionable insights that inform strategic decisions.
- Its workflow involves data collection, cleaning, analysis, visualization, and structured decision-making, not just reporting tools.
Most business owners assume business intelligence means dashboards and reports for the IT team. That assumption is costing you decisions. Business intelligence (BI) is a technology-driven set of strategies and tools that analyzes business information and transforms it into actionable insights for strategic and tactical decision-making. The difference between BI and plain reporting is the same as the difference between a GPS and a paper map: one tells you where you are and what to do next, the other just shows you the terrain. This guide breaks down what BI actually is, how it works, and how SMEs can put it to work starting now.
Table of Contents
- Understanding business intelligence: key concepts and processes
- How business intelligence benefits small and medium enterprises
- Business intelligence vs business analytics: what SMEs need to know
- Applying business intelligence in your small or medium business
- The overlooked truth about business intelligence for SMEs
- Explore how Blue Prysm empowers your business intelligence journey
- Frequently asked questions
Key Takeaways
| Point | Details |
|---|---|
| BI transforms data | Business intelligence turns raw data into clear, actionable insights for better business decisions. |
| Core BI process | BI involves data collection, analysis, visualization, and using insights to guide strategy and operations. |
| SME-focused benefits | BI empowers small businesses with faster insights, efficiency gains, and competitive advantages through user-friendly visuals. |
| BI vs analytics | Business intelligence describes past and present data; business analytics predicts and prescribes future actions. |
| Embed BI in decisions | For true value, BI must be integrated into decision workflows with trusted data and focus on key management questions. |
Understanding business intelligence: key concepts and processes
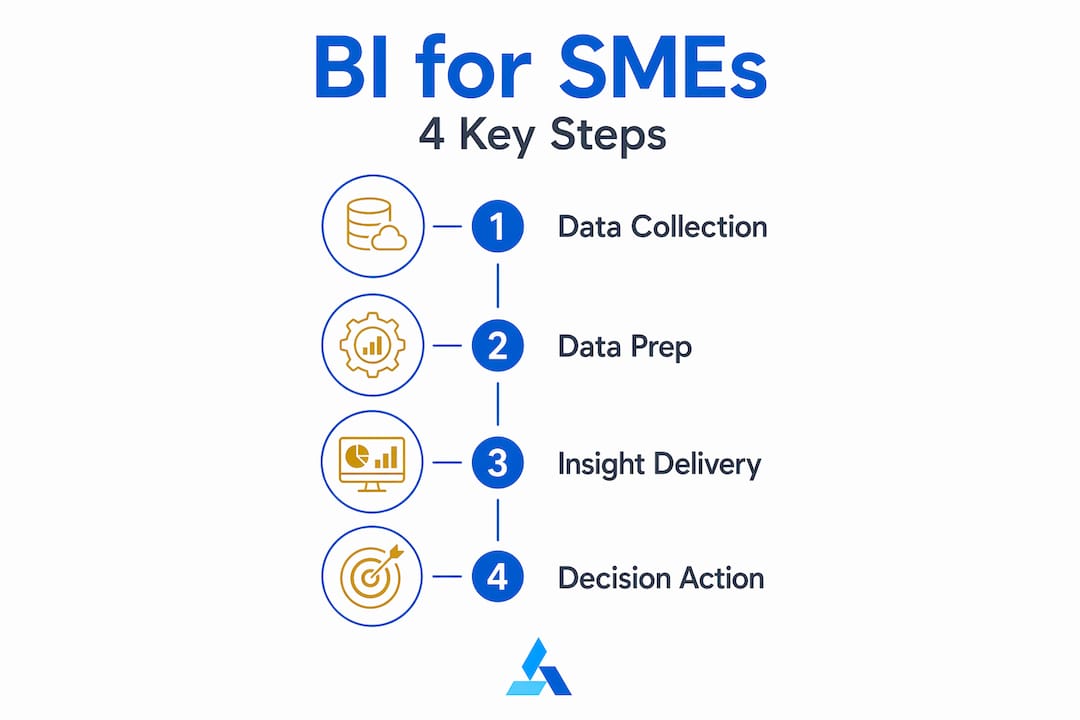
BI is not one tool. It is a workflow. Data moves through a pipeline, gets shaped into something readable, and ends up in front of the person who needs to act on it. Understanding that pipeline is the first step to using BI well.
The core process follows five stages:
- Data collection: Pulling raw data from sources like your CRM, sales platform, accounting software, and website analytics.
- ETL (Extract, Transform, Load): Cleaning, formatting, and loading that data into a central warehouse or database.
- Analysis: Running queries against your data to surface patterns, anomalies, or trends.
- Visualization: Presenting findings through charts, dashboards, or reports that humans can read at a glance.
- Decision-making: Acting on those findings in a structured way that connects insight to outcome.
BI includes data collection, preparation, analytical querying, and delivery of insights via reports and dashboards using ETL and OLAP techniques. OLAP, or Online Analytical Processing, is a method that lets you slice data across multiple dimensions simultaneously. For example, you could analyze sales revenue by region, product category, and time period all at once, without writing a single line of code.
BI tools automate previously manual analysis using ETL processes and data visualization to help organizations move from insights to action. That is not a minor upgrade. Before automation, someone on your team was probably pulling spreadsheets every Monday morning and manually copying figures into a summary document. Automated BI pipelines eliminate that entirely.
Key techniques you will encounter include:
- Interactive dashboards: Live visual panels that update automatically as new data flows in.
- Ad hoc reporting: On-demand reports built around specific one-off questions.
- Drill-down analysis: Starting with a high-level metric and clicking through to its root cause.
- Scheduled reports: Automated summaries sent to stakeholders on a fixed cadence.
Building a sound business decision making process starts with knowing which data inputs actually matter to your recurring choices.
Pro Tip: Before you buy any BI tool, audit your data sources first. If your sales data uses different naming conventions than your finance data, your dashboards will be wrong before you even launch them. Data quality is the foundation everything else depends on.
How business intelligence benefits small and medium enterprises
Having explored BI’s core process, let’s look at the specific benefits it brings to small and medium businesses. The honest answer is that BI levels a playing field that has historically tilted toward large corporations with analyst teams and data engineering departments. Self-service BI tools have changed that equation significantly.
BI helps SMEs by turning data into easy-to-understand visual insights, enabling decision-makers to grasp current business states and past performance at a glance. That matters most when you are wearing five hats and cannot afford to spend two hours digging through spreadsheets before a Monday leadership meeting.
Here is where SMEs see the most immediate returns:
- Faster decisions: Instead of waiting for someone to compile a monthly report, your leadership team sees live KPIs every morning.
- Reduced inefficiencies: BI surfaces where you are losing time or money. A retail SME might discover that 30% of refund requests cluster around one specific SKU, not a process problem.
- Better team alignment: When everyone is looking at the same numbers on the same dashboard, arguments about “whose data is right” disappear.
- Competitive awareness: Tracking your own performance trends helps you spot when market conditions are shifting before competitors do.
- Customer insight: Behavior patterns in your own data often reveal what your customers actually want, not what you assume they want.
“Modern BI features self-service analytics, allowing business users to prepare and share insights without relying heavily on IT, increasing agility.”
This matters enormously for SMEs. You do not have an IT department available on demand. Self-service BI means your marketing manager can pull her own campaign performance report without filing a ticket. Your operations lead can check fulfillment times for last quarter without asking anyone. That independence is not just convenient: it is a structural advantage.
Understanding competitive intelligence for SMEs goes hand in hand with using your internal BI outputs effectively. The two together give you a full picture: what your business is doing and what the market is doing around you.

Pro Tip: Do not try to monitor everything at once. Pick five to eight KPIs that directly reflect your most critical strategic questions. BI becomes overwhelming when it is trying to answer questions nobody is actually asking.
Business intelligence vs business analytics: what SMEs need to know
To avoid confusion, it is important to understand how business intelligence differs from business analytics. Founders often use the two terms interchangeably, but they describe different capabilities with different purposes.
BI primarily focuses on descriptive analytics, meaning what is happening and what has happened, whereas business analytics covers predictive and prescriptive analytics, meaning why it happened and what might happen next. In plain terms, BI tells you your customer churn rate went up 12% last quarter. Business analytics tells you why it went up and what to do about it.
| Feature | Business intelligence | Business analytics |
|---|---|---|
| Primary focus | Historical and current data | Future outcomes and causes |
| Question answered | What happened? | Why, and what next? |
| Core output | Dashboards, reports, KPIs | Models, predictions, recommendations |
| Typical users | Managers, executives, team leads | Data scientists, analysts |
| Complexity | Moderate | High |
| SME entry point | Accessible with most BI tools | Requires statistical or ML expertise |
When should you prioritize BI over business analytics as an SME?
- Start with BI if: You do not yet have reliable, consistent data flowing from your core systems.
- Start with BI if: Your leadership team is still making decisions primarily from gut feeling or ad hoc spreadsheets.
- Consider adding analytics if: You have 12 or more months of clean historical data and you need to forecast demand or model pricing scenarios.
- Consider adding analytics if: You are in a market with rapid, unpredictable shifts where backward-looking data alone is not enough.
Most SMEs need to walk before they run. Getting your decision intelligence for SMEs practice grounded in solid BI foundations first will make the jump to analytics far less painful later.
Applying business intelligence in your small or medium business
Now let’s translate BI concepts into concrete actions your business can take to harness its full potential. The biggest trap most SMEs fall into is buying a BI tool, connecting it to their data, and then wondering six months later why nobody is using it. Implementation is not a tech project. It is a behavior change project that happens to involve technology.
Here is a practical sequence that actually works:
- Identify your recurring management questions. What do you ask in every leadership meeting? Revenue vs. target? Customer acquisition cost? Inventory turnover? Start there.
- Audit your data sources. Which systems hold the data that answers those questions? Map them out before touching a tool.
- Define your KPIs explicitly. Write down exactly how each metric is calculated. This prevents inconsistency when you build your pipelines.
- Choose a BI tool that fits your scale. Do not over-engineer for a 20-person business. Your needs now are not your needs in three years.
- Build your ETL pipelines. Connect your sources, clean the data, and validate that your dashboards are showing accurate numbers before rolling them out.
- Train your users on interpretation, not just navigation. Knowing how to click through a dashboard is not the same as knowing how to act on what it shows.
- Embed BI into your decision workflows. Make the dashboard a fixed agenda item in leadership meetings. BI only creates value when someone acts on what it surfaces.
BI is most actionable when designed around KPIs and recurring management questions, supporting decision workflows rather than just reporting. That sentence should live on a sticky note above every BI project kickoff.
Consistency in data definitions and quality of ETL pipelines is critical to making dashboards trustworthy decision tools. A dashboard people do not trust gets ignored. Build trust first by validating every number your dashboard shows against a known correct source before you go live.
Reviewing data-driven strategy examples from businesses at your stage can also shortcut your learning curve significantly.
Pro Tip: Designate one person as your data steward, even if it is a part-time responsibility. Their job is to catch inconsistencies, update definitions, and maintain your single source of truth. Without this role, data quality erodes silently over time.
The overlooked truth about business intelligence for SMEs
With practical application in view, here is what most BI articles will not tell you directly: the majority of SME BI projects fail not because of bad technology, but because of bad habits.
We see it constantly. A business owner invests in a solid BI platform, spends weeks setting up dashboards, and then finds six months later that the leadership team has gone back to the spreadsheet in the shared drive. Why? Because nobody changed how decisions were being made. The dashboard became a passive chart nobody interrogated.
The uncomfortable reality is that BI requires a cultural commitment, not just a software subscription. Think of it this way: buying a treadmill does not make you healthier. Using it consistently, as part of a routine, does. BI is identical. The tool creates the possibility of insight. The discipline of embedding that insight into your business decision making process is what creates the actual competitive advantage.
There is also a second, less discussed failure mode: data inconsistency. Many SMEs underestimate how messy their data actually is before they try to formalize it. Sales numbers in the CRM do not match the finance system. Customer counts differ between marketing and ops. When BI surfaces these contradictions publicly on a dashboard, the instinct is to blame the tool rather than fix the underlying data. Resist that instinct. The dashboard did its job. It showed you the inconsistency. Now fix the source.
The SMEs that truly benefit from BI treat it as a strategic practice, not a one-time technology project. They review their KPIs regularly. They ask hard questions when a metric moves unexpectedly. They use the data to challenge assumptions, not to confirm them. That mindset, more than any particular feature set, is what separates businesses that grow with BI from businesses that just spend money on it.
Explore how Blue Prysm empowers your business intelligence journey
Understanding BI is one thing. Having the right tools to put it into practice is another entirely. Blue Prysm is built specifically for business decision-makers who need real intelligence without the consulting bill.
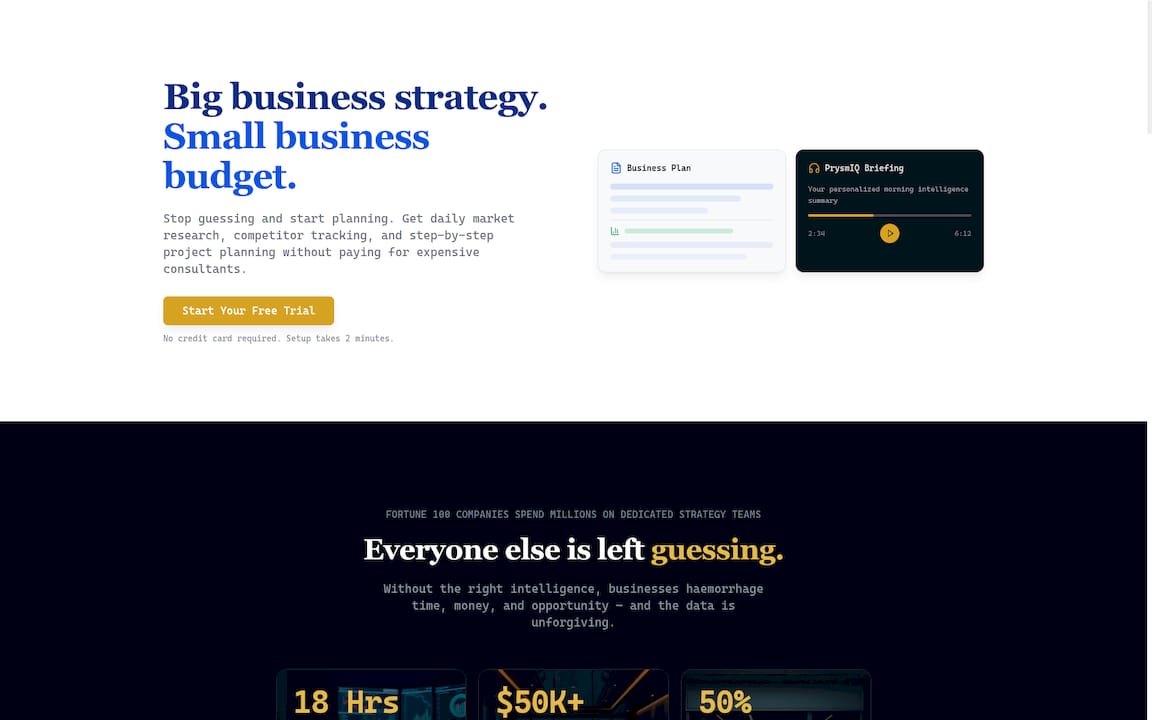
The Blue Prysm platform gives you AI-powered market briefings, competitor monitoring, and planning tools designed for the way SME leaders actually work. Rather than building a BI stack from scratch, you get structured intelligence delivered in formats that connect directly to your decisions. Explore how Blue Prysm works to see how the platform pulls market data, competitive signals, and strategic frameworks into one place. And if you are validating a new idea or testing a business case, the Puffery Detector tool helps you cut through the noise and get to what is actually true about your market. This is BI built for the scale and speed SMEs actually need.
Frequently asked questions
What is business intelligence in simple terms?
Business intelligence means using technology and tools to collect, analyze, and present data so business owners and managers can make better decisions based on clear, actionable insights rather than gut feeling.
How can BI help my small business grow?
BI helps small businesses by turning data into visual insights that show exactly how the business is performing, so leaders can act faster and fix problems before they compound.
What is the difference between business intelligence and business analytics?
BI describes what has happened using historical and current data, while business analytics goes further by using advanced models to predict future outcomes and recommend specific actions.
What are common mistakes when implementing BI for SMEs?
The most common mistake is treating BI as just a reporting tool rather than integrating it into decision workflows, which turns expensive dashboards into charts nobody acts on.
How do I start using business intelligence in my company?
Start by writing down the five to eight questions your leadership team asks every week, then identify which data sources hold the answers and choose a BI tool that connects them without requiring engineering expertise.
Recommended
- Strategic intelligence: Unlock smarter decisions for SMEs – Articles & Blogs
- Competitive intelligence for SMEs: strategies and tools – Articles & Blogs
- Unlock the power of decision intelligence for SMEs – Blue Prysm – Articles & Blogs
- Master the business decision making process for smarter growth – Articles & Blogs