

TL;DR:
- Data analytics transforms raw organizational data into actionable evidence that drives decision-making and growth.
- Effective use requires clear ownership, clean data foundations, and governance structures that close the insight-to-action loop.
Data analytics in business is the practice of converting raw organizational data into evidence that directly informs decisions, reduces operational risk, and drives measurable growth. Tools like Tableau, Power BI, and Salesforce Data 360 have made this practice accessible beyond Fortune 500 boardrooms. A 2024 to 2025 UK government study found that 51% of businesses analyzing digital data reported service or product improvements, compared to just 19% of those that did not. That gap is not a coincidence. It is the compounding return on treating data as a decision asset rather than a reporting afterthought.
What is data analytics in business, and how does it differ from business intelligence?
Most leaders use the terms data analytics, business analytics, and business intelligence interchangeably. That is a mistake with real consequences for how you structure your teams and your investments.
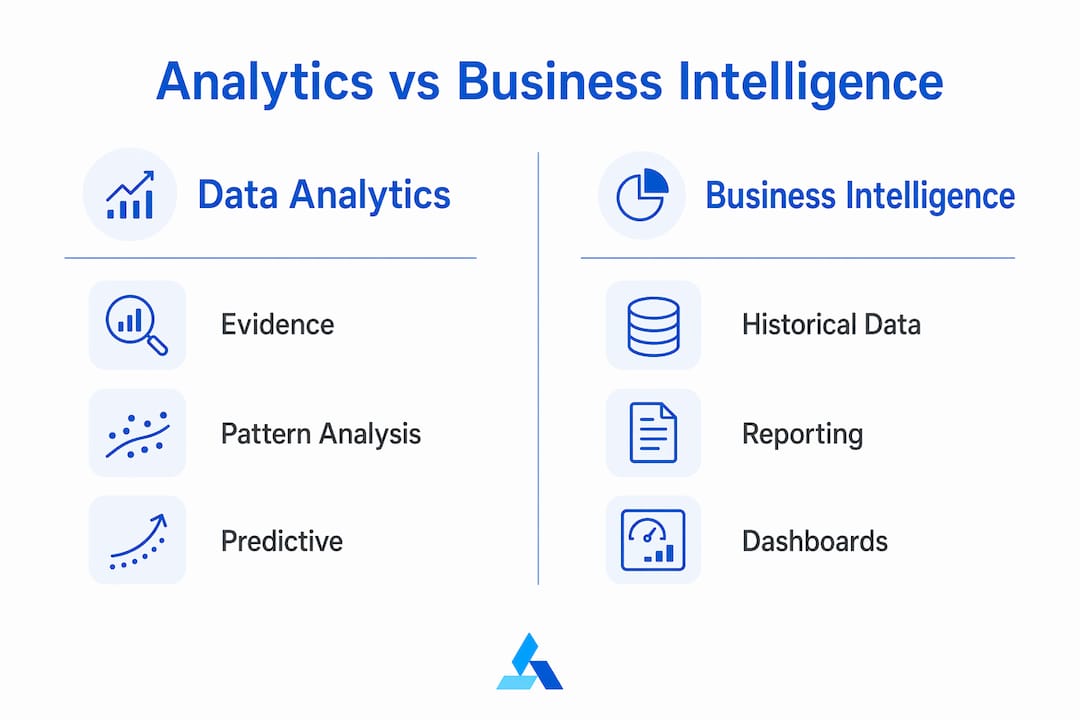
Data analytics produces evidence. It answers the question: “What does the data show?” Business analytics takes that evidence and ties it to business priorities, assigning clear decision ownership and recommending a course of action. Business intelligence, by contrast, focuses primarily on reporting and dashboards that surface historical performance. Think of BI as the rearview mirror, data analytics as the map, and business analytics as the navigator telling you which turn to take.
Business analytics adds diagnostic, predictive, and prescriptive layers that explain what patterns mean and recommend actions, going well beyond traditional BI reporting. In enterprise settings, all three disciplines interact: BI surfaces the data, analytics interprets it, and business analytics closes the loop with a decision.
The table below clarifies how these three disciplines divide the work:
| Discipline | Primary focus | Key output |
|---|---|---|
| Business intelligence | Historical reporting and dashboards | KPI summaries, scorecards |
| Data analytics | Pattern identification and evidence generation | Statistical findings, trend analysis |
| Business analytics | Decision support and action recommendation | Forecasts, scenario plans, strategic direction |
Understanding this distinction matters because many organizations invest heavily in BI dashboards and then wonder why decisions still feel like gut calls. The answer is that dashboards show you what happened. Analytics tells you why, and what to do next.
What are the core types of data analytics and their uses in business?
Analytics capability is not binary. It exists on a spectrum, and most organizations are stuck at the low end without realizing it. Organizations often fail to move beyond descriptive reporting, missing the compounding value that comes from diagnostic, predictive, and prescriptive stages.
Here is how each type functions in practice:
- Descriptive analytics answers “What happened?” It aggregates historical data to show sales trends, customer churn rates, or website traffic patterns. Every monthly performance report your team produces is descriptive analytics.
- Diagnostic analytics answers “Why did it happen?” It uses techniques like root cause analysis, correlation studies, and drill-down reporting to explain the drivers behind a trend. If revenue dropped 12% in Q3, diagnostic analytics tells you whether that was pricing, a competitor move, or a supply chain issue.
- Predictive analytics answers “What is likely to happen next?” It applies statistical models and machine learning to forecast demand, identify at-risk customers, or project cash flow. Netflix uses predictive analytics to determine which content to commission before a single episode is filmed.
- Prescriptive analytics answers “What should we do about it?” It goes beyond prediction to recommend specific actions, often through optimization algorithms or scenario planning. Uber applies prescriptive analytics to surge pricing, routing, and driver allocation in real time.
The business value compounds as you move up this ladder. Descriptive analytics informs. Diagnostic analytics explains. Predictive analytics prepares. Prescriptive analytics decides. Most SMEs operate almost entirely in descriptive mode, which is why their data feels like a history book rather than a strategy tool.
Pro Tip: Before investing in predictive or prescriptive tools, audit whether your descriptive data is clean, consistent, and trusted by the people who use it. A sophisticated model built on dirty data produces confident wrong answers.
How does data analytics tangibly benefit businesses and improve productivity?
The business case for analytics is no longer theoretical. The evidence is specific, recent, and hard to dismiss.
The UK Department for Science, Innovation and Technology commissioned a large-scale study in 2024 to 2025 examining how data use correlates with business outcomes. The headline finding was stark: businesses analyzing digital data reported service and product improvements at nearly three times the rate of non-analyzers. That is not a marginal edge. It is a structural performance gap between companies that treat data as a decision input and those that treat it as a compliance record.
The benefits extend across multiple dimensions of business performance:
Operational efficiency improves when analytics identifies waste, bottlenecks, and underperforming processes before they become expensive problems. Coca-Cola uses analytics across its supply chain to optimize inventory levels and reduce distribution costs at scale.
Revenue growth accelerates when customer behavior data informs product development, pricing, and marketing spend. Starbucks analyzes purchase history and location data to personalize offers through its loyalty program, driving repeat purchase rates that most retailers cannot match.
Risk reduction is perhaps the least celebrated benefit. Data-driven decision-making reduces uncertainty and risk while improving outcomes like operational efficiency and customer insights. When decisions are grounded in evidence rather than assumption, the cost of being wrong drops significantly.
“The goal is to turn data into information, and information into insight.” — Carly Fiorina, former CEO of HP
The critical nuance from the UK study is worth repeating: data capability alone is insufficient without active use. Collecting data and analyzing data are two different organizational behaviors, and only one of them produces results. For leaders building a data-driven strategy, the priority is not more data. It is more decisions made with the data you already have.
What are common challenges in implementing data analytics?
Most analytics initiatives do not fail because of bad technology. They fail because of bad governance, unclear ownership, and a phenomenon worth naming directly: insight theater.
Insight theater is what happens when a business invests in dashboards, runs regular analytics reviews, and produces polished reports that nobody acts on. The analytics function looks productive. The decisions do not change. This is more common than most leaders admit, and it is expensive.
Analytics initiatives require a connected data foundation, clear ownership, and governance structures that balance decision speed with insight quality. Harvard Business School’s Data-Driven Agility and Decision Governance (DADG) framework identifies this as the central challenge: organizations build analytics capability without building the decision infrastructure to use it.
Here are the four most common implementation failures and how to address them:
- No decision ownership. Analytics without a named decision-maker produces reports, not outcomes. Every analytics workstream should be tied to a specific decision, owned by a specific person, with a defined timeline.
- Timing misalignment. Insights delivered after a decision has already been made are useless. Analytics teams need to understand the decision calendar of the business, not just the data calendar.
- Dirty data foundations. Effective data-driven decision-making requires clean, collected, and consistently structured data before analysis begins. Skipping this step is the single most common reason analytics projects underdeliver.
- No feedback loops. Analytics improves when decisions and their outcomes are tracked and fed back into the models. Organizations that treat analytics as a one-way information flow miss the compounding learning effect.
Pro Tip: Start every analytics initiative by writing a one-paragraph decision brief: what decision needs to be made, who owns it, what data is required, and what the deadline is. If you cannot write that brief, the initiative is not ready to start.
What tools and applications help integrate analytics into business decisions?
Choosing the right analytics tools is less about features and more about fit with your team’s capability and your organization’s decision workflow.

Tableau excels at interactive data visualization techniques, allowing non-technical users to explore data through drag-and-drop dashboards. It is widely used in sales, marketing, and operations teams that need to surface patterns without writing code.
Power BI, Microsoft’s business intelligence analytics platform, integrates tightly with Excel and the Microsoft 365 ecosystem. For organizations already running on Microsoft infrastructure, it offers the fastest path to connected reporting and self-service analytics.
Salesforce Data 360 combines CRM data with analytics to give revenue teams a unified view of customer behavior, pipeline health, and campaign performance. It is particularly powerful for B2B businesses where deal cycles are long and customer data is complex.
Beyond platforms, data visualization techniques include not just standard bar and line charts but advanced types like heat maps for geographic or behavioral density, bubble charts for multi-variable comparisons, and Sankey diagrams for visualizing flow and resource allocation. Choosing the right chart type is not an aesthetic decision. It is a communication decision that determines whether an insight lands or gets ignored.
| Tool | Best use case | Key strength |
|---|---|---|
| Tableau | Interactive exploration and visualization | Accessible for non-technical users |
| Power BI | Enterprise reporting and Microsoft integration | Cost-effective for Microsoft shops |
| Salesforce Data 360 | Customer and revenue analytics | Unified CRM and analytics view |
AI-powered analytics platforms, including predictive analytics services, are now automating the diagnostic and predictive layers that previously required dedicated data science teams. For SMEs without in-house analysts, this shift is significant. It means the analytical capability gap between large enterprises and smaller competitors is narrowing fast.
Pro Tip: Before selecting a platform, map your top five business decisions from the last quarter. Then ask which tool would have made those decisions faster or better. That exercise will tell you more than any feature comparison.
For a deeper look at building effective dashboards, the data dashboard guide covers practical setup and visualization choices for business professionals in 2026.
Key takeaways
Data analytics in business delivers measurable competitive advantage only when evidence generation is paired with clear decision ownership, clean data foundations, and governance structures that close the loop between insight and action.
| Point | Details |
|---|---|
| Analytics types build on each other | Progress from descriptive to prescriptive analytics to unlock compounding decision value. |
| Data use beats data collection | Businesses that actively analyze data report product improvements at nearly three times the rate of non-analyzers. |
| Insight theater is a real cost | Dashboards without decision ownership produce reports, not outcomes. Assign ownership before building. |
| Tool choice follows workflow | Select analytics platforms based on your existing decision processes, not feature lists. |
| Governance accelerates decisions | A connected data foundation with clear stewardship reduces decision cycle time and improves insight reliability. |
Why most analytics programs are solving the wrong problem
I have worked with enough leadership teams to recognize a pattern that rarely gets named honestly. Most analytics programs are built to satisfy the question “What does our data show?” when the question that actually drives business value is “What decision does this change?”
That distinction sounds subtle. It is not. When you build analytics around the data you have, you produce reports. When you build analytics around the decisions you need to make, you produce direction. The former feels productive. The latter actually is.
The other trap I see constantly is the governance gap. Leaders invest in platforms, hire analysts, and then leave the connection between insight and decision entirely to chance. Nobody owns the feedback loop. Nobody tracks whether the decisions informed by analytics produced the outcomes the models predicted. Without that loop, your analytics program is not learning. It is just repeating.
The AI-powered decision-making tools available today are genuinely impressive. But they amplify whatever decision culture already exists in your organization. If that culture is reactive and assumption-driven, better tools make you faster at being wrong. The prerequisite is not technology. It is the discipline to define what you are deciding, who owns it, and how you will know if you got it right.
Start there. The tools will follow.
— Colin Bowdery
How Blue Prysm helps you turn analytics into strategy
Most businesses have more data than direction. Blue Prysm is built to close that gap.
Blue Prysm’s AI-powered strategic intelligence platform gives business leaders daily market briefings, competitor monitoring, and scenario planning tools that translate data signals into concrete strategic options. You do not need a data science team or a six-figure consulting retainer. You need the right intelligence, structured for the decisions you are actually making. Whether you are validating a new market opportunity or tracking a competitor’s moves, Blue Prysm delivers the analytical depth that used to be reserved for Fortune 100 strategy teams. See how it works and find out how quickly you can move from data to decision.
FAQ
What is data analytics in business?
Data analytics in business is the process of examining organizational data to generate evidence that informs decisions, improves operations, and supports strategic growth. It spans descriptive, diagnostic, predictive, and prescriptive methods depending on the depth of insight required.
How is data analytics different from business intelligence?
Business intelligence focuses on historical reporting and dashboards, while data analytics identifies patterns and generates evidence. Business analytics goes further by tying that evidence to specific business decisions with clear ownership and recommended actions.
What are the main benefits of data analytics for business leaders?
The primary benefits include improved product and service innovation, reduced operational costs, better customer insight, and lower decision risk. UK government research from 2024 to 2025 found that businesses actively analyzing data reported service improvements at nearly three times the rate of those that did not.
Which analytics tools are best for business decision-makers?
Tableau, Power BI, and Salesforce Data 360 are the most widely adopted platforms for business analytics. The right choice depends on your existing technology stack, team capability, and the specific decisions you need to support.
Why do analytics initiatives fail?
Most analytics programs fail due to unclear decision ownership, timing misalignment between insights and decisions, poor data quality, and the absence of feedback loops. Technology is rarely the root cause.