
Continuous, AI-powered market and competitor intelligence is the single biggest lever most small and mid-sized businesses are not pulling. The next step is concrete: pick one strategic pillar this week, define one metric to track, and set up an automated alert. That is the whole game at the start. BizTech Magazine reports that most SMBs stay stuck in reactive mode not because they lack tools, but because their data are poorly defined before they ever turn AI on. Fix the definition first; the speed follows.
Two signals worth anchoring to right now:
- The Small Business & Entrepreneurship Council’s 2026 research shows AI adoption among SMBs correlating with measurable revenue gains and hours recovered, particularly when applied to market intelligence workflows.
- AI market intelligence automates continuous collection and interpretation of customer, competitor, and market signals, making insights accessible to teams that previously needed a dedicated analyst.
Key Takeaways
AI-powered real-time market analysis gives SMBs a continuous, verifiable intelligence layer that replaces quarterly guesswork with weekly verified signals and faster, lower-risk strategy decisions.
| Point | Details |
|---|---|
| Define metrics before tools | Agree on metric definitions in writing before connecting any data source or alert. |
| Start with one data lane | A single clean signal from one lane beats noisy output from five poorly configured ones. |
| Verify every AI signal | Require a clickable source URL and a human spot-check before any signal drives a decision. |
| 30/90/180-day milestones | First clean signal by day 30, two lanes integrated by day 90, full ROI cycle by Month 3. |
| Blue Prysm pilot | Blue Prysm’s platform scopes a 30-day pilot to one pillar and two data lanes with built-in strategy frameworks. |
What does real-time market analysis actually mean for SMB strategy?
Not stock tickers. Not trading dashboards. For an SMB executive, real-time market analysis means a continuous, AI-powered feed of market and competitor signals that informs strategic planning, roadmapping, OKRs, and execution decisions. Think of it as replacing the quarterly market research report with a living intelligence layer that updates daily or faster.
The contrast with periodic research matters. A quarterly study tells you where the market was. Continuous signals tell you where it is moving. The difference shows up in decisions: a pricing move you catch in 48 hours is one you can respond to; one you catch in 90 days is one you read about in a competitor’s press release.
This article does not cover financial data services, stock quotes, or trading analytics. Those are a different product for a different audience.
The strategic questions live market insights actually answer:
- Is a competitor changing pricing, and how fast should we respond?
- Are product-market fit signals shifting in customer reviews or social sentiment?
- Is demand spiking in a segment we have underweighted in our roadmap?
- Which customer cohort is showing early churn signals this month?
Why should SMBs care about continuous market signals?
The business case is not abstract. Continuous signals reduce reaction time and lower decision risk by replacing gut feeling with a verifiable, timestamped feed. SMB surveys on AI-driven insights show meaningful revenue gains and hours recovered when AI handles the collection and normalization work that previously consumed analyst time.
Practical use cases tied to revenue or cost outcomes:
- Pricing reactions: Catch a competitor’s discount within hours, not weeks, and run a targeted counter-offer before the deal window closes.
- Campaign pivots: Spot a sentiment shift in social listening data and redirect ad spend before the quarter ends.
- Churn prevention: Flag a cohort showing declining engagement in your ops data and trigger a retention workflow before renewal.
- Roadmap prioritization: Surface a demand spike in a product category and reprioritize the next sprint before the planning meeting.
Competitive intelligence routines built around market positioning, competitor moves, and customer intelligence can run on a modest weekly time budget when organized into repeatable cadences.
Which data sources and tool categories should you actually use?
Map the job to the lane. Each data source answers a different strategic question, and trying to monitor all of them simultaneously at the start is the fastest way to produce noise instead of signal.
| Data Lane | What It Contributes | Typical Sources |
|---|---|---|
| Social listening | Voice, sentiment, trending topics | Social posts, forums, Reddit threads |
| Web/traffic analytics | Demand signals, content gaps | Site behavior, search trends |
| Review and survey text | Qualitative product signals | G2, Capterra, Google Reviews |
| Competitor public signals | Pricing moves, offer changes | Pricing pages, press releases |
| Internal ops/sales data | Conversion rates, churn signals | CRM, billing, support tickets |
| Public filings and news | Macro market shifts | SEC filings, news APIs |
For public company tracking and regulatory signals, tools like Filingsiq automate the parsing of SEC filings and 10-K summaries, which is useful when your market includes publicly traded competitors or partners.
AI tools using ML and NLP parse unstructured data from reviews and social posts and apply predictive analytics to forecast demand and churn, making continuous monitoring feasible without a dedicated data team.
Pro Tip: Before automating any data lane, get your team to agree in writing on what each metric means. “Churn” defined as 30-day lapse and “churn” defined as 90-day lapse produce completely different dashboards. Misaligned definitions are the primary reason AI-generated reports mislead rather than inform.
How do you implement this in six steps?
A structured rollout prevents the most common failure: buying tools before defining what you need them to tell you.
- Assess readiness (Week 1, Owner: Strategy lead) — Audit existing data sources, identify gaps, and document which strategic pillars need intelligence coverage. Artifact: a one-page data inventory.
- Define strategic pillars and metrics (Week 2, Owner: CEO/COO) — Select two or three strategic pillars (e.g., pricing competitiveness, product-market fit, demand by segment) and one KPI per pillar. Artifact: a signed metric definition document.
- Choose a minimal toolset (Week 3, Owner: Strategy or ops lead) — Start with one social listening tool, one web analytics source, and your existing CRM. Resist the urge to add more until the first two lanes are producing clean signal.
- Integrate data (Weeks 4–6, Owner: Ops or technical lead) — Connect sources to a central dashboard. Stale or uneven data freshness is a leading cause of inaccurate reports; prioritize daily or continuous syncing over weekly snapshots.
- Automate alerts and workflows (Week 6–8, Owner: Strategy lead) — Set threshold-based alerts for each KPI. A 30-minute weekly workflow across five lanes (pricing, positioning, reviews, SEO/content, social) can produce one high-signal action per week.
- Measure ROI (Month 3 onward, Owner: CEO) — Track time-to-decision, number of verified signals acted on, and revenue or cost outcomes tied to those actions. Artifact: a monthly intelligence ROI summary.
Timeline and cost shape:
Before acting on any AI-derived signal, apply a quick verification rule: confirm the finding has a clickable source URL, spot-check three raw data points behind the summary, and have one human reviewer sign off. AI surfaces the pattern; a person confirms it is real.
What should you ask vendors before buying?
Group your questions by risk category. Vendors who cannot answer these clearly are telling you something important.
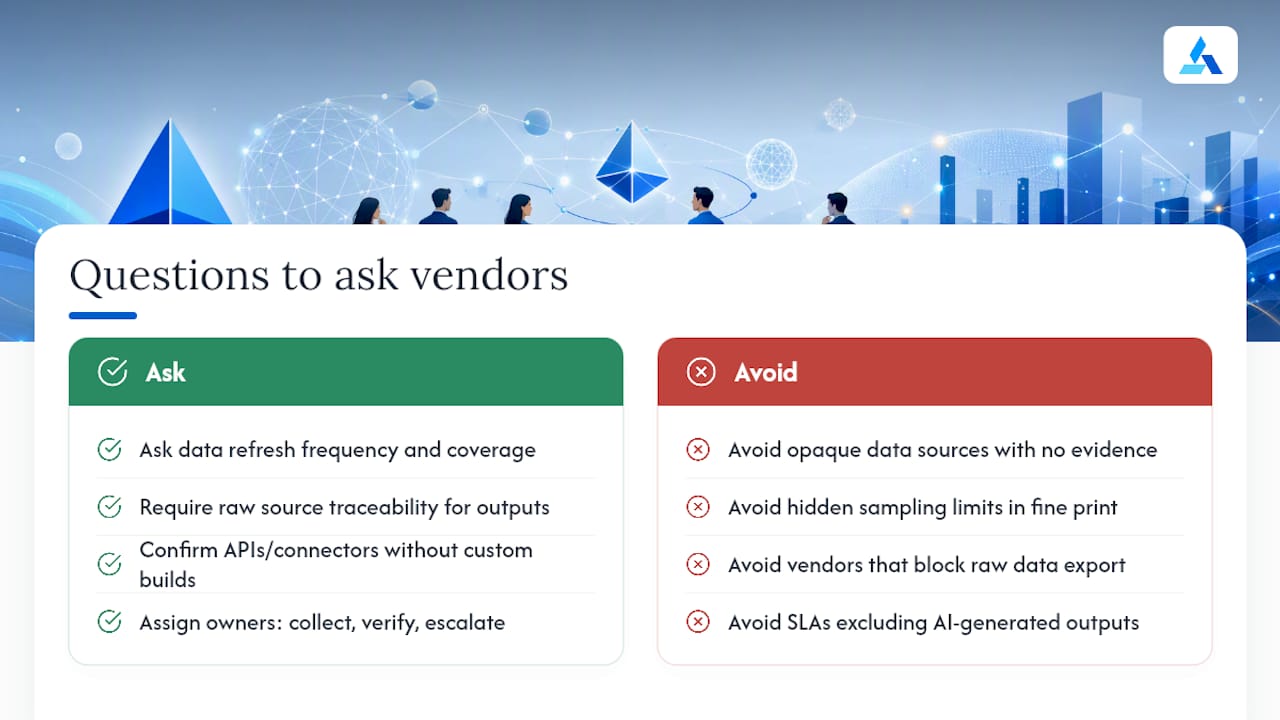
Data coverage and freshness: How often does the data refresh? Is it truly continuous or batched nightly? What is the geographic and language coverage for your specific market?
Explainability: Can the platform show you the raw source behind any AI-generated summary? If a competitor pricing alert fires, can you click through to the actual pricing page that triggered it?
Integration and APIs: Does it connect to your existing CRM, project management tool, or data warehouse without a custom build?
Privacy and security: How is customer data handled? Is the platform SOC 2 compliant? What data leaves your environment?
Pricing model: Is pricing per seat, per data volume, or per feature? Hidden overages on data volume are a common trap.
Red flags to walk away from: opaque data sources with no raw evidence view, sampling limits buried in the fine print, inability to export raw data, and SLA language that excludes AI-generated outputs from uptime guarantees.
For role clarity, assign ownership before the tool goes live: one person owns signal collection, one verifies before escalation, and one executive has authority to act. Without that matrix, alerts pile up unread.
What does AI actually do in this pipeline, and where does it fail?
AI accelerates scale and pattern detection. It does not replace the judgment call. That distinction matters more than most vendors will tell you.
In a well-built pipeline, AI handles:
- Collection: Continuous crawling of social, review, pricing, and news sources
- Normalization: Cleaning and structuring unstructured text into comparable data
- Clustering: Grouping similar signals to surface themes rather than noise
- Sentiment scoring: Tagging customer and competitor language as positive, negative, or neutral
- Forecasting: Projecting demand or churn trends from historical patterns
Human checks belong at the output layer: before any signal becomes a decision, a person verifies the source, checks data freshness, and confirms the metric definition has not drifted.
Common mistakes and how to avoid them:
- Overreliance on raw AI outputs: An AI summary without a source link is an opinion, not intelligence. Require source citations on every alert.
- Metric misalignment: If the definition of a KPI changes but the alert threshold does not, every report after that point is wrong. Stale or inconsistently defined data produces misleading dashboards even when the underlying tool is working correctly.
- Ignoring data freshness: A nightly batch feed looks like real-time monitoring but misses intraday moves. Confirm refresh cadence before signing a contract.
Pro Tip: Build a two-minute verification habit into every weekly intelligence review. Pull one raw source behind the AI summary, confirm it matches the claim, and log the check. Teams that skip this step are the ones that act on a hallucinated competitor price drop.
How Blue Prysm operationalizes a real-time market analysis plan
A mid-sized B2B software company using Blue Prysm faced a familiar problem: their quarterly competitive review was always three months behind the market. Pricing decisions were made on instinct. The team connected three data lanes through Blue Prysm’s platform: competitor public signals, customer review text, and internal CRM churn data.
Within the first 30 days, an automated alert flagged a competitor’s pricing page change. The strategy lead verified the source, confirmed the delta, and the team ran an A/B pricing test within 48 hours. That single action, sourced from a live signal rather than a quarterly report, informed the next OKR cycle.
| Blue Prysm Feature | Measurable Outcome |
|---|---|
| Automated competitor alerts | 48-hour response to pricing moves |
| Sentiment clustering on reviews | Product roadmap reprioritized within one sprint |
| Execution dashboard with KPI tracking | Weekly signal-to-action rate visible to leadership |
| Strategy library (50+ frameworks) | OKR alignment completed in one session, not three |
For teams ready to run a pilot, Blue Prysm’s market analysis platform supports a structured 30-day trial scoped to one strategic pillar and two data lanes. The how to analyze market trends guide walks through the full methodology.
The part most guides skip
The friction in rolling out continuous market intelligence is almost never the technology. It is the organization. Teams resist trusting a signal they did not generate themselves, and that skepticism is healthy until you build a verification habit that earns their confidence.
Research across SME adoption studies consistently shows that adoption gaps are organizational, driven by unclear ownership and insufficient role-specific training, rather than technical. The fix is not a better tool. It is a clearer role matrix and a weekly cadence that produces one verified action, not a 40-slide report nobody reads.
My recommendation: start with one person, one pillar, one metric, and one alert. Run it for four weeks. When that person can show leadership a verified signal that changed a decision, the rest of the organization will ask to be included.
Stop flying blind on strategy when a better option exists
Most SMBs spend more on coffee than on the intelligence infrastructure that should be driving their pricing, product, and GTM decisions. Blue Prysm closes that gap without a six-figure consulting retainer or a six-month implementation.
The platform connects your competitor signals, customer sentiment, and internal ops data into a single execution dashboard, with 50+ strategy frameworks built in so your team moves from insight to roadmap in the same session. A 30-day pilot scoped to one strategic pillar costs a fraction of one bad pricing decision. A 90-day pilot produces a verified intelligence cadence your leadership team can present to the board.
For teams interested in Agentic AI workflows that automate the collection-to-alert pipeline, Blue Prysm’s agent layer at Agentsente handles continuous monitoring without manual intervention.
Start your pilot at Blueprysm and scope your first 30 days in under an hour.
Sources
The sources below back the core claims in this article and are worth reading in full if you are building a business case or evaluating vendors.
- Small businesses are suffering from a lack of data sophistication | BizTech Magazine
- Sogood
- Competitive Intelligence Market | AGENTYX Insights
- Confident Reports. Stale Data. | Why Your Numbers Are Wrong
FAQ
What is real-time market analysis for SMBs?
It is a continuous, AI-powered feed of competitor, customer, and market signals that informs strategic planning and execution, not a stock or financial data service. The goal is faster, lower-risk decisions on pricing, product, and GTM strategy.
How long does it take to get the first useful signal?
Most SMBs see a clean, verified signal from their first data lane within 30 days, assuming metric definitions are agreed on before setup begins.
How much does an SMB intelligence stack cost per month?
A minimal stack covering one or two data lanes typically runs $200–$800 per month in the first 30 days, scaling to $1,000–$3,000 as additional lanes and automation are added by month six.
How does Blue Prysm fit into this workflow?
Blue Prysm’s platform connects competitor signals, customer sentiment, and internal ops data into one execution dashboard, with automated alerts and 50+ strategy frameworks built in, so teams move from signal to roadmap without switching tools.
What is the biggest mistake SMBs make with AI market intelligence?
Acting on AI-generated summaries without verifying the underlying source. Every alert should carry a clickable source URL and pass a human spot-check before it drives a strategy or pricing decision.