
Market opportunity analysis is a structured process that tests whether a specific market, segment, or category is worth entering, based on real demand, a workable competitive structure, and margins you can actually live on. It replaces gut instinct with a go or no-go recommendation backed by numbers. Done right, it tells you not just “is this a good idea” but “what do we invest next, and where.”
The output isn’t a binder of research. It’s a ranked list of opportunities, a defensible market-size estimate, and a clear read on what capital or capabilities you need next to move. Two frameworks anchor almost every credible version of this process: TAM/SAM/SOM sizing to quantify the prize, and a SWOT or PESTEL scan to stress-test the environment around it.
Here’s your first move, today, before you build a single spreadsheet: write down the exact customer segment you think you’re serving, in one sentence, and identify the first data point you need to confirm they actually have the problem you think they have. Everything downstream, sizing, competitive mapping, forecasting, depends on getting that sentence right first.
By the numbers: A viable opportunity has to clear three conditions at once, according to entrepreneurship researchers: genuine market demand, a market structure that permits entry, and margins and resources the business can realistically sustain. Miss any one of the three and you don’t have an opportunity. You have an interesting idea.
Pro Tip: Before you run a single sizing model, write your target customer profile as if you were describing them to a stranger at a bar. If you can’t do it in three sentences without hedging, you don’t know your market yet, you’re guessing at it.
Key Takeaways
A market opportunity analysis works because it forces a demand-tested, margin-checked, competitor-aware recommendation instead of a hopeful guess dressed up in research.
| Point | Details |
|---|---|
| Define the segment first | Write a one-sentence customer profile before building any sizing model or spreadsheet. |
| Size with TAM, SAM, SOM | Use bottom-up math from your actual sales capacity, not a flat percentage of TAM. |
| Validate demand with real interviews | Ten to fifteen customer conversations catch bad assumptions before they reach your board deck. |
| Check unit economics early | Run a rough CAC, LTV, and margin check in week one, not after you’re excited about the market size. |
| Speed the workflow with Blue Prysm | Blue Prysm’s real-time market insights and competitor tracking compress weeks of manual research into days. |
What Is Market Opportunity Analysis, Really?
Most founders think market analysis means “research the market.” That’s not wrong, it’s just incomplete to the point of being useless. Market opportunity analysis is decision-focused. It exists to produce a recommendation, not a description.
The distinction matters because plenty of teams spend six weeks building a 40-slide market landscape deck that describes trends, names competitors, and cites growth rates, and still can’t answer the one question that matters: should we do this? A real analysis forces an answer by combining quantitative sizing data with qualitative customer insight, then running both through a competitive and financial filter.
Think of it as a funnel. You start broad (what’s the total category worth?) and narrow relentlessly (what can we actually capture, at what cost, against who?) until you land on a number you’d bet your own capital on. If you wouldn’t bet your own money on the number, the analysis isn’t finished.
Why Bother? The Business Case for Running One
Skipping this step doesn’t save time. It just moves the cost of finding out you were wrong from the analysis phase, where it’s cheap, to the execution phase, where it’s expensive and public.
Running a proper opportunity analysis before you commit capital delivers a few concrete outcomes:
- Sharper capital allocation. You stop funding three mediocre ideas evenly and start funding the one with real demand signals fully.
- Lower execution risk. You catch the competitive or margin problem in week three, not month nine, when your team is already hired and your lease is signed.
- Better product-market fit, faster. Customer discovery baked into the analysis surfaces the actual buying motive, not the one you assumed.
- Stronger fundraising position. Investors don’t fund market stories. They fund market math, and a demand-tested, sized opportunity is math.
- Internal alignment. When the executive team and the board are arguing about strategy, a shared, evidence-based sizing document ends the argument faster than another meeting does.
A rigorous analysis walks through both internal and external variables using something like SWOT or PESTEL, weighing what the business controls against what the market imposes on it, and that discipline is what separates a real assessment from a wish list.
Here’s a version of this that plays out constantly: a SaaS company plans to launch in a new vertical based on one enthusiastic prospect call. A two-week opportunity scan reveals the vertical’s buying cycle is 14 months longer than their current one and their unit economics don’t survive that cash-flow gap. The launch gets delayed a quarter, retooled around a faster-cycle segment instead, and the pivot ships profitable inside six months. That’s what the analysis is for. It doesn’t kill good ideas. It kills bad timing.
When Should You Actually Run One?
You don’t need a six-week deep dive every time someone floats an idea in a Slack channel. Match the depth of the analysis to the size of the bet.
- Entering a new geography. Different regulatory environment, different buying behavior, different competitive set. Budget 3-4 weeks for a full pass; a quick scan (one week) works if you’re expanding into an adjacent city or state with near-identical demographics to a market you already serve.
- Launching a major new product line. If it’s a meaningful departure from your core offering, run the full toolkit: sizing, competitive mapping, SWOT, customer discovery. Two to six weeks depending on how novel the category is to you.
- Considering an acquisition. The target’s stated market and your own sizing rarely match. Give this a full 4-6 week pass, because the mistake here costs a lot more than a slow product launch.
- Preparing for investor diligence. Investors will run their own version of this analysis anyway. Get ahead of it with a compact one-to-two week scan so your numbers survive their questions.
- Facing declining growth in a core segment. This is the trigger teams skip most often because it feels like admitting failure. A quick scan (one week) on adjacent segments can reveal whether the problem is your product or your market’s maturity curve.
- Testing a pivot under pressure. When runway is short, you don’t have six weeks. A tight 5-day scan focused purely on demand signal and unit economics beats no analysis at all.
The rule of thumb: if the decision is reversible and cheap, a quick scan is fine. If it commits real capital, headcount, or your company’s positioning for a year or more, do the full version.
Core Frameworks and Types of Analysis You’ll Actually Use
You don’t need every framework in the strategy canon. You need four or five that answer distinct questions, used together instead of in isolation.
SWOT looks inward and outward at once, mapping your strengths and weaknesses against external opportunities and threats. It’s a synthesis tool, not a research tool. It works best after you’ve already gathered the market facts, because SWOT is a bridge between data and strategic options, not a substitute for sizing or unit-economics work. Our own breakdown of a startup-specific SWOT list walks through what founders tend to leave out.
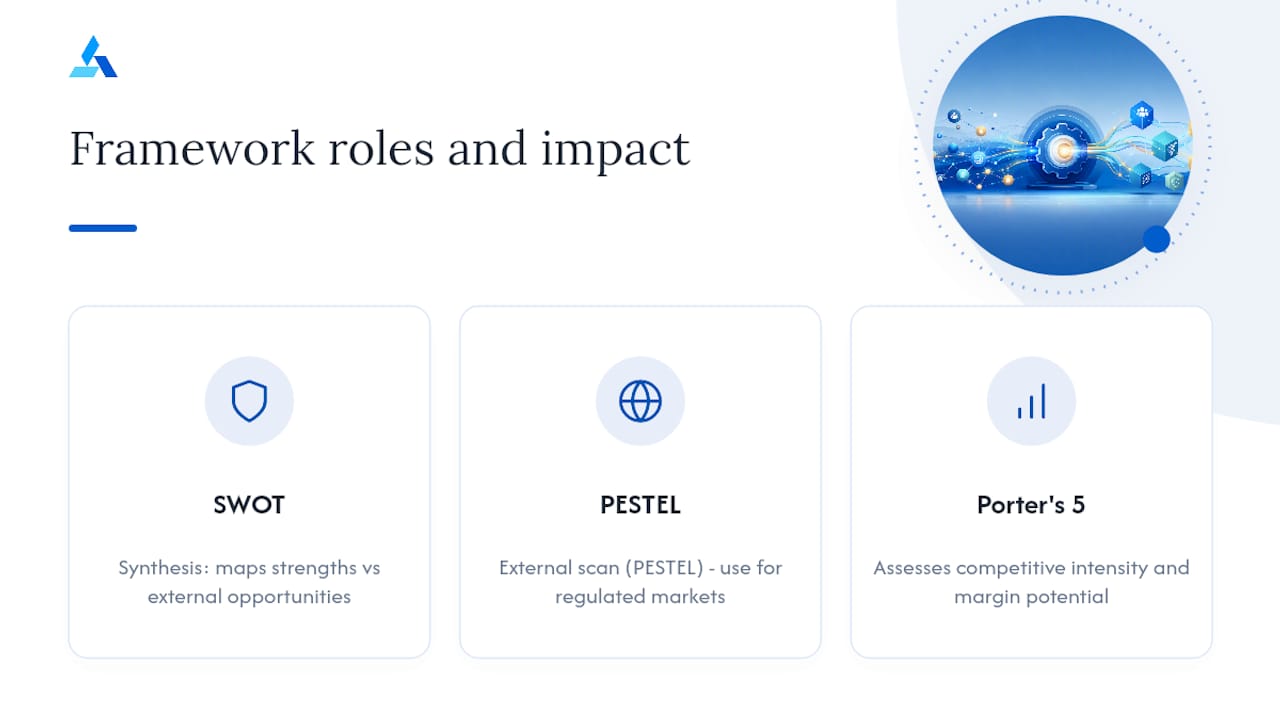
PESTEL (sometimes shortened to STEEP) scans political, economic, social, technological, environmental, and legal forces shaping the market from outside your control. Use it when you’re entering a new geography or a regulated industry, where the external environment can override even a great product.
Porter’s Five Forces examines competitive intensity: buyer power, supplier power, threat of substitutes, threat of new entrants, and rivalry among existing players. This is the framework that tells you whether the market structure itself will let you earn a decent margin, even if demand is real.
The Business Model Canvas forces you to articulate how you’ll actually capture value, revenue streams, cost structure, channels, rather than just describing the market.
Customer discovery interviews are the qualitative backbone underneath all of the above. Frameworks organize your thinking; interviews are where you find out if your thinking is right.
For a 2-6 week analysis, a practical toolkit looks like this: PESTEL for the external scan (week one), five to fifteen customer interviews running in parallel, Porter’s Five Forces once you’ve mapped competitors, and SWOT at the end to synthesize everything into strategic options. Our strategic frameworks guide breaks down when each one earns its place versus when it’s just busywork.
The Step-by-Step Process for Running Your Analysis
Here’s the roadmap, in order, with rough timing for a mid-sized bet:
- Define purpose and target segment (days 1-2). Write the one-sentence customer profile from the opening of this article. Be specific about who, not vague about “everyone who needs X.”
- Build the research plan (days 2-3). Split it into primary research (interviews, surveys) and secondary research (industry reports, public data). Decide sample size now, not mid-project.
- Size the market (days 4-8). TAM, SAM, SOM, covered in depth below.
- Map the competitive landscape (days 8-12). Who’s already winning here, and why?
- Run customer validation (days 10-16, overlapping with step 4). Ten to fifteen real conversations with prospective buyers, testing your assumed pain point and price sensitivity.
- Check unit economics (days 16-20). Can you acquire a customer for less than they’re worth to you, within a payback period your cash position can survive?
- Set decision criteria and forecast (days 20-25). Build the best/likely/worst scenarios.
- Write the recommendation (days 25-30). One page, plus an appendix nobody will read unless they push back.
Deliverables at each stage matter as much as the steps themselves. Executives don’t want your interview transcripts; they want a one-slide summary of what customers said and why it changes your sizing. Investors don’t want your full competitive matrix; they want the three competitors that could kill you and why you’ll survive them anyway.
Pro Tip: For primary research, book interviews in batches of five and review the notes between batches. If your fourth and fifth interview aren’t confirming or contradicting anything new, you’ve hit saturation. Stop interviewing and start analyzing; more conversations at that point are just procrastination dressed up as diligence.
Pro Tip: The most common sizing overreach is anchoring your SOM to “just 1% of the TAM.” One percent of a billion-dollar market sounds achievable and means nothing, because it ignores your actual sales capacity, channel access, and competitive resistance. Build SOM from the bottom up, from your actual conversion funnel, not from a top-down percentage that feels modest.
This is also where Agentic AI earns its place in the process rather than as a buzzword. A platform built for this workflow can pull competitive intelligence and market signal continuously instead of you manually refreshing a spreadsheet every quarter, run the sizing scenarios in minutes instead of a day of Excel modeling, and flag when a competitor’s pricing or positioning shifts mid-analysis. The market opportunity assessment workflow we’ve mapped out shows where each of these seven stages benefits most from automation versus where human judgment still has to drive.
Market Sizing in Practice: TAM, SAM, SOM Explained
TAM (Total Addressable Market) is the total revenue opportunity if you captured 100% of the market, globally, with zero competition. It’s a ceiling, not a plan.
SAM (Serviceable Addressable Market) narrows that down to the segment you can actually reach given your business model, geography, and target customer, ignoring competitive share for now.
SOM (Serviceable Obtainable Market) is your realistic capture, the number you actually build a business plan around, based on your sales capacity, channel access, and competitive position.
Two methods get you there. Top-down starts with an industry report’s total market figure and narrows it by percentage assumptions. It’s fast but easy to fool yourself with, since the narrowing percentages are often guesses dressed up as precision. Bottom-up starts from your actual customer segment: how many potential buyers exist, what will they pay, how many can you realistically reach in year one? It’s slower to build but far harder to fake.
A worked example. Say you’re launching a scheduling tool for independent physical therapy clinics.
- TAM: Roughly thirty-eight thousand independent PT clinics in the US, each spending an estimated several thousand dollars a year on scheduling and practice-management software. TAM therefore is in the tens of millions of dollars.
- SAM: You only serve clinics with 2-10 practitioners (your product isn’t built for solo practices or large multi-location chains). This makes up a majority share of the market. SAM totals tens of millions of dollars accordingly.
- SOM: Given your sales team’s realistic capacity and a typical SaaS penetration curve for a new entrant, you model capturing 3% of SAM in year three. SOM = $54.7 million x 3% = $1.64 million in annual recurring revenue.
Run the sensitivity range around that SOM figure instead of presenting one number. That spread is the honest answer, and it’s more useful to a decision-maker than false precision.
| Assumption | Source | How to Adjust It |
|---|---|---|
| Number of independent PT clinics | Industry association member directories, Census Bureau business counts | Cross-check against Census Bureau’s County Business Patterns for your specific NAICS code |
| Average annual software spend per clinic | Vendor pricing pages, industry analyst reports | Validate directly through 8-10 customer interviews before finalizing |
| Serviceable segment share | Internal product-fit assessment | Revisit if you expand product features to serve larger clinics |
| Year-three penetration rate (3%) | Comparable SaaS benchmarks for new entrants in fragmented verticals | Adjust downward if the sales cycle proves longer than modeled |
Metrics and Forecasting: Turning Market Size Into a Real Number
A market size on its own tells you nothing about whether the business works. You need a small set of operating metrics layered on top:
- Conversion funnel assumptions, the percentage of leads that become trials, and trials that become paying customers.
- Penetration rate, your realistic share of SAM captured over a defined time horizon.
- Customer acquisition cost (CAC), fully loaded, including sales and marketing spend, not just ad spend.
- Lifetime value (LTV), projected revenue per customer over their expected tenure, adjusted for churn.
- Payback period, how many months it takes to recover CAC from a given customer.
- Margin per unit, what’s actually left after cost of goods or service delivery.
- Break-even volume, the number of customers needed to cover fixed costs.
A simple forecast template has two halves: inputs (SOM, penetration rate, price, CAC, churn) and outputs (revenue by quarter, gross margin, cash burn or contribution, break-even timing). Run it three times, best, likely, worst, changing only the penetration and churn assumptions between scenarios. Everything else stays fixed so you can see exactly which variable is driving the swing.
Pro Tip: When you present the forecast to decision-makers, never lead with the single “likely” number. Lead with the range and name the one or two assumptions that would move you from worst case to best case. Executives trust a forecast more when you show them what has to be true for it to hold, not just what the answer is.
Mapping the Competitive Landscape and Finding Real Gaps
Build a competitor matrix across four generic categories rather than obsessing over every named player: incumbents (established, well-resourced, slow to move), challengers (funded, aggressive, chasing the same segment you are), niche entrants (small, focused, often underestimated), and substitutes (a different category solving the same underlying problem, like a spreadsheet replacing dedicated software).

Plot them on a positioning map with two axes that matter to your buyer, price versus service depth, or breadth of features versus specialization. The empty quadrants are your white space. The crowded quadrants are red space, and crowded doesn’t mean impossible, but it does mean you need a sharper wedge to win there. Our competitive landscape guide walks through building that map step by step.
Not every gap is worth exploiting. Check for these signals before you commit:
- Low incumbency strength. The leading players in the gap are undercapitalized, distracted, or serving it as an afterthought.
- Documented customer dissatisfaction. Actual complaints, churn reasons, or review patterns, not your assumption that “someone must be unhappy.”
- Regulatory tailwinds. A rule change is opening the door rather than closing it.
- A defensible entry point. Distribution partnerships, proprietary data you already hold, or a go-to-market motion competitors can’t easily copy.
A gap without at least two of those four signals is usually a mirage. Companies chase market share numbers that look open on paper and discover the incumbent was simply ignoring the segment on purpose, because it isn’t profitable enough to bother defending. Our guide on competition examples shows how this plays out across different industries.
Mistakes That Quietly Kill Good Analyses
The failure mode isn’t usually laziness. It’s overconfidence dressed up as rigor. Watch for these specific traps:
- Over-relying on top-line TAM. A billion-dollar TAM feels exciting and tells you nothing about whether you can capture a dollar of it. Mitigation: always present SOM alongside TAM, never TAM alone.
- Ignoring adoption dynamics. New categories don’t adopt at the same speed as mature ones. Mitigation: benchmark your penetration curve against a comparable category’s actual adoption history, not a straight-line guess.
- Optimistic penetration assumptions. “We’ll capture 10% in year one” is almost always wishful thinking. Mitigation: anchor penetration assumptions to your actual sales capacity and channel access, not the market’s theoretical size.
- Neglecting unit economics until the end. Teams size the market, get excited, and only check CAC and margin after they’ve already pitched the board. Mitigation: run a rough unit-economics check in week one, before you invest in a full sizing model.
- Biased primary research. Interviewing only your existing network or enthusiastic early adopters skews demand signal upward. Mitigation: recruit at least half your interview sample from outside your existing network.
Know when to kill an idea outright. If your customer interviews reveal weak, unforced demand (people are polite but not urgent), if your margin math doesn’t clear a sustainable threshold even in the best-case scenario, or if the competitive gap you identified evaporates once you dig past the surface, that’s your signal to stop. Killing an idea in week two is a win, not a failure. It’s the entire point of running the analysis in the first place.
SWOT vs. Market Analysis: Two Different Jobs
These get used interchangeably, and that’s where a lot of confusion comes from. SWOT is a synthesis framework: internal strengths and weaknesses set against external opportunities and threats, four quadrants, one page. Market analysis is a research process: sizing the market, mapping competitors, scanning trends, testing demand with real customers. One organizes conclusions. The other generates the facts those conclusions are built on.
| Dimension | SWOT | Market Analysis |
|---|---|---|
| Primary function | Synthesizes internal and external factors into strategic options | Researches market size, competitors, trends, and customer demand |
| Typical output | A four-quadrant summary of strengths, weaknesses, opportunities, threats | TAM/SAM/SOM figures, competitor map, forecast scenarios |
| Best used when | You already have market facts and need to decide strategic direction | You need to establish the facts before any strategic decision |
| Time investment | Hours to half a day, once inputs exist | One to six weeks depending on scope |
Sequence them correctly and each one gets sharper. Run your market analysis first to generate real inputs, then use SWOT to translate those findings into strategic choices your leadership team can actually argue about and decide on. Running SWOT first, with no market data behind it, just produces four lists of opinions.
Tools, Data Sources, and When AI Actually Speeds This Up
Good secondary research starts with public data you don’t have to pay for. The US Census Bureau publishes business counts by industry code, useful for validating your TAM. The Bureau of Labor Statistics tracks employment and wage data by sector, helpful for sizing labor-dependent markets. Google Trends shows you directional demand shifts over time, not absolute volume, but a useful sanity check on whether interest in your category is rising or falling. Industry analyst reports (Gartner, IBISWorld, and similar publishers) give you top-down TAM estimates worth cross-checking against your bottom-up build.
Beyond data sources, you’ll want a working toolkit: a survey tool for structured customer feedback, a competitor-intelligence tool that tracks pricing and feature changes without manual checking, a financial modeling template for the TAM/SAM/SOM and unit-economics math, and a customer discovery interview guide so your five interviewers ask the same core questions.
This is exactly where an AI-powered platform changes the math on time investment. Manually tracking ten competitors’ pricing pages, feature releases, and positioning shifts eats hours every week that most strategy teams don’t have. Automated competitive intelligence tools that continuously monitor those signals and surface only what changed let a two-person strategy team cover ground that used to require a full analyst. The same logic applies to scenario forecasting: running best/likely/worst sizing scenarios by hand in a spreadsheet takes an afternoon; running them through an Agentic AI system that already holds your assumptions takes minutes, and you can rerun them the moment a new data point comes in.
Turning Your Findings Into an Actual Decision
Everything above is worthless if it doesn’t end in a recommendation someone can act on. Structure the final report around six sections: an executive summary, market size and assumptions, the competitive landscape, unit economics, risks and mitigations, and a clear recommendation with next steps. Keep it to one page, with everything else living in an appendix nobody’s forced to read.
Before you write the recommendation, run your findings against explicit decision criteria rather than a gut check: minimum viable demand signal (do customers describe this as urgent, or nice-to-have?), a margin threshold you set before you started (not after you saw the numbers), and a penetration rate you can defend with your actual sales capacity, not an aspirational one. Good market opportunity analyses culminate in exactly this kind of compact, transparent output, assumptions stated plainly enough that someone else could challenge them.
When you present to executives or investors, lead with the one-page TL;DR: recommendation first, then the three numbers that support it (SOM, unit economics, and the biggest risk), then stop talking and let them ask questions. The appendix answers those questions. It shouldn’t need to answer the first one.
What Actually Separates a Good Analysis From a Wasted One
The teams that get this right share one habit: they treat customer validation as non-negotiable, not as a step they’ll get to if time allows. I’ve seen far more analyses fail from skipped customer interviews than from bad math. The math is usually fine. The assumption feeding the math, that customers want this badly enough to pay, is where the wheels come off, and it’s almost always because someone extrapolated from a handful of enthusiastic conversations with people who were never going to be the buyer.
Conservative unit-economics thresholds matter more than most founders want to admit. It’s tempting to model a CAC that assumes your best channel performs at scale the way it performed in a small pilot. It never does. Set your thresholds assuming your second-best channel becomes your primary one, because that’s usually what happens once you’re spending real budget instead of testing with free traffic.
The most useful pattern I’ve watched play out repeatedly is small, cheap experiments validating large opportunities before any capital gets committed. A landing page with a waitlist, a manual concierge version of the product sold to five customers by hand, a limited regional pilot instead of a national launch. These aren’t shortcuts around rigor. They’re rigor, applied at a scale that’s cheap to be wrong about.
One habit worth adopting from skeptical analysts: run your own company’s confident claims through something like a puffery detector before you put them in a board deck. If a statement can’t survive being restated as “compared to what, measured how,” it’s marketing language, not analysis. Pair that with a quick venture-score style gut check, demand, structure, margin, on any new idea before you spend a single research hour on it. Half the ideas that sound exciting in a Monday meeting won’t survive that five-minute test, and that’s exactly the point of running it early.
How Blue Prysm Compresses the Entire Workflow
Everything in this guide, the sizing math, the competitive mapping, the forecasting scenarios, is work strategy teams have historically done by hand, in spreadsheets, over weeks. Blue Prysm exists to compress that timeline without cutting the rigor that makes the output trustworthy in the first place.
A mid-sized services company evaluating a new regional market used Blue Prysm’s real-time market insights and competitor tracking to build a defensible SOM estimate and a live competitive map in days instead of the month a manual pass would have taken, giving the leadership team a go decision they could actually stand behind at the board level. That’s the real value: not replacing judgment, but giving your team the raw material to exercise judgment faster and with fewer blind spots.
The platform’s strategy framework library holds more than 50 templates, so you’re not rebuilding a SWOT matrix or a Porter’s Five Forces grid from scratch every time a new opportunity comes up. Competitive intelligence briefings update automatically instead of requiring someone to manually refresh a tracking sheet every Friday. If your team is ready to run its next opportunity analysis in days instead of weeks, start with the Market Analysis Platform and see how much of this roadmap it can carry for you.
Sources
- Chapter 12: Opportunity Analysis — Business LibreTexts
FAQ
What Does Market Opportunity Analysis Actually Mean?
It means testing whether a specific market or segment is worth entering by measuring real demand, competitive structure, and achievable margins, then producing a clear go or no-go recommendation rather than a descriptive report.
How Do You Do a Market Opportunity Analysis?
Define your target segment, size the market using TAM/SAM/SOM, map competitors, validate demand through customer interviews, check unit economics, and build a forecast with best, likely, and worst scenarios before writing a one-page recommendation.
What Is a Market Analysis in Simple Terms?
A market analysis is the research process that answers who your customers are, what trends are shaping the category, and how competitors operate, combining hard numbers with customer conversations to reduce the risk of a bad decision.
What Is the Difference Between SWOT and Market Analysis?
SWOT synthesizes internal strengths and weaknesses against external opportunities and threats into strategic options, while market analysis is the research that generates the facts, sizing, competitors, trends, that SWOT organizes into a decision.
How Long Should a Market Opportunity Analysis Take?
A quick scan for a low-risk decision can take about a week, while a full analysis for a major product launch, new geography, or acquisition typically runs two to six weeks depending on scope.
Recommended
- Market Opportunity Assessment Workflow: 7 Stages to a Decision –
- Market Analysis Platform — Real-Time Insights for Strategy Teams | Blue Prysm
- Market Insights Software — AI-Powered Insights for Strategy Teams | Blue Prysm
- Unlock the power of decision intelligence for SMEs – Blue Prysm – Articles & Blogs