TL;DR:
- Big data involves capturing and analyzing data at high speed from diverse sources to enable faster, strategic decisions. Its true scope is defined by volume, velocity, variety, veracity, and value, which shape the necessary technology and governance frameworks. Organizations that embed governance, leverage real-time analytics, and focus on specific business outcomes gain a sustainable competitive advantage.
Most executives hear “big data” and picture enormous spreadsheets or server rooms drowning in noise. That framing is wrong, and it costs companies real money. Big data is not just about volume. It’s about capturing data at speed, from wildly different sources, and turning that complexity into decisions faster than your competitors can. The global big data market is projected to hit $249.06 billion by 2030. That’s not a technology trend. That’s a strategic imperative, and understanding it clearly is where your advantage begins.
Table of Contents
- Key takeaways
- What big data really means for business
- Practical applications driving real results
- Market trends shaping big data adoption
- Privacy and legal obligations you cannot ignore
- Strategies to turn big data into competitive advantage
- My take on where big data strategy actually breaks down
- How Blueprysm puts big data intelligence to work for you
- FAQ
Key takeaways
| Point | Details |
|---|---|
| Big data goes beyond volume | The five V’s — volume, velocity, variety, veracity, and value — define big data’s true scope and business relevance. |
| Real-time analytics creates measurable wins | Streaming analytics reduces fraud detection processing time by 73%, showing concrete ROI for data-driven investment. |
| Compliance is non-negotiable | GDPR mandates Data Protection Impact Assessments for high-risk processing, with fines reaching EUR 10 million for violations. |
| Governance is the foundation, not a footnote | Unified data governance led by Chief Data Officers is the critical success factor for scaling AI and big data enterprise-wide. |
| Visualization bridges data and decisions | The right data visualization tools convert raw analytical output into business intelligence that decision-makers can actually use. |
What big data really means for business
The phrase gets thrown around so carelessly that its meaning has been diluted almost to uselessness. So let’s be precise about what big data consists of, because the characteristics determine the technology choices, the governance requirements, and the business value on the other side.
Big data is defined by five characteristics. Volume refers to the sheer scale, often petabytes of data that no traditional relational database can process efficiently. Velocity is the speed at which new data arrives, think real-time transaction streams, social media feeds, and IoT sensor outputs. Variety covers the formats: structured data like SQL tables, unstructured data like emails and video, and semi-structured formats like JSON logs. Veracity addresses data quality and trustworthiness, which is where most projects quietly fail. And value is the only characteristic that actually matters to your business: what decisions does this data enable?

The platforms that handle these characteristics look nothing like traditional database tools. Apache Spark processes distributed workloads across clusters. Apache Kafka manages high-throughput event streaming. Data lakes store raw, unprocessed data at scale before it gets refined for analytics. Cloud and hybrid-cloud infrastructures make this scalable without requiring owned hardware.
| Traditional technology | Big data technology |
|---|---|
| Relational databases (SQL) | Distributed storage (data lakes, Hadoop) |
| Batch processing | Real-time streaming (Kafka, Spark Streaming) |
| Structured data only | Structured, unstructured, semi-structured |
| On-premise servers | Cloud and hybrid-cloud infrastructure |
| Siloed analytics | Unified analytics platforms |
Where data visualization software comes in is at the output layer. Tools like Tableau, Power BI, and Looker translate processed big data into charts, dashboards, and interactive reports that a CFO or operations director can act on without needing a data science degree. Big data visualization is not cosmetic. It’s the mechanism by which analytical output becomes a business decision.
Practical applications driving real results
Big data analytics is not theoretical. Across industries, it is changing how organizations detect threats, serve customers, and manage operations.

The clearest proof point is fraud detection. Streaming analytics systems reduce processing time by 73% and achieve 99.97% accuracy in fraud detection, handling billions of transactions with sub-80ms decision latency. That’s not a marginal improvement. It’s the difference between catching fraud before a transaction settles and discovering it in the quarterly audit. Real-time fraud pipelines using Spark Structured Streaming can achieve sub-300ms latency, eliminating the legacy complexity of running separate batch and streaming engines simultaneously.
Beyond fraud, the applications span every industry:
- Customer behavior analytics: Retailers analyze clickstream data, purchase history, and real-time browsing patterns to personalize offers at the individual level, not the segment level.
- Supply chain optimization: Manufacturers combine supplier data, logistics feeds, and demand signals to cut inventory costs and reduce stockouts before they happen.
- Predictive maintenance: Industrial companies use sensor data from equipment to predict failures days in advance, reducing unplanned downtime by 30 to 50 percent in documented deployments.
- Healthcare risk stratification: Hospitals apply big data analytics to patient records, lab results, and historical outcomes to identify high-risk patients before they deteriorate.
Big data and data mining transform raw transactions into features that machine learning models use to detect patterns, including statistical features, behavioral baselines, velocity signals, and historical comparisons. The point is not the technology itself. The point is that every one of these applications is generating competitive separation. If your competitors are doing this and you aren’t, you already know what the gap costs.
Pair these applications with strong data visualization and you have a system where insights move from raw data to a C-suite dashboard in near real time. That’s the operational picture big data analytics is designed to create.
Market trends shaping big data adoption
The big data and analytics market is growing at a 13.2% compound annual growth rate, driven by three converging forces: AI integration, real-time streaming adoption, and increasing regulatory reporting requirements. Each of these deserves a strategic read, not just a headline mention.
AI and big data have become inseparable. Machine learning models require training data at a scale that only big data infrastructure can supply. More significantly, AI inference in production requires continuous data pipelines to stay accurate, meaning AI quality is directly dependent on data pipeline quality. Organizations that treat their data infrastructure as an afterthought will find their AI investments underperforming.
Real-time streaming analytics is shifting from experimental to standard practice. Multi-layered architectures that balance batch analytics for deep historical analysis and real-time streaming for fast incident response are becoming the baseline in regulated industries like financial services, healthcare, and logistics.
A few other trends worth watching:
- The rise of the Chief Data Officer role as a board-level position, signaling that data governance is now a corporate governance issue.
- Increasing EU and global regulatory requirements pushing organizations to formalize data management practices.
- Demand for unified AI and data platforms that reduce tool sprawl and centralize governance.
- Growth in edge computing, processing data closer to the source for faster, lower-latency analytics without always routing through central cloud.
The businesses that will win through 2030 are not necessarily those with the most data. They are the ones that have built the governance, infrastructure, and analytics capability to extract value from it consistently.
Privacy and legal obligations you cannot ignore
If you are building or scaling a big data program, compliance is not a legal team problem you hand off and forget. It is a design constraint that must be baked into your architecture from day one.
Under GDPR Article 35, a Data Protection Impact Assessment is mandatory before beginning any high-risk data processing activity. High-risk processing includes large-scale profiling, systematic monitoring of publicly accessible spaces, and processing sensitive personal data at scale. The fines for ignoring this are not symbolic. Non-compliance can result in penalties reaching EUR 10 million or 2% of worldwide annual turnover.
In April 2026, the European Data Protection Board published a harmonized EU-wide DPIA template that standardizes how organizations document risk assessment, mitigation plans, and supervisory consultation requirements. If your organization operates in the EU or processes EU resident data, this template is now the benchmark.
DPIAs should be treated as living documents, not one-time checkboxes. They must be updated whenever processing activities change materially, and reviewed regularly even when nothing has changed. A good DPIA framework distinguishes between design risks, the structural vulnerabilities built into your data architecture, and incident risks, the operational failures that can occur after deployment.
There’s also the re-identification problem. AI systems can memorize training data and enable re-identification of individuals even from supposedly anonymized datasets. Traditional anonymization techniques are no longer sufficient. Best practice now combines synthetic data for model testing, strict access controls, and formal governance over who can query what.
Pro Tip: Map your data processing activities against the DPIA trigger criteria before you build, not after. Retrofitting compliance into a live big data pipeline is expensive and disruptive. Design the governance in from the start, and your DPIA becomes a documentation exercise rather than a crisis response.
Strategies to turn big data into competitive advantage
Knowing what big data is and understanding the trends gets you to the starting line. Actually building a program that delivers competitive separation requires a different set of decisions, and most organizations get this part wrong.
IBM research identifies a clear pattern among the most successful data-led organizations: Chief Data Officers who treat AI as the foundation for new business models, not as a tool bolted onto existing workflows, focus on unified ERP systems and trusted governance structures. They don’t run AI experiments in isolated silos. They build infrastructure that can scale AI enterprise-wide because the data feeding it is governed, trustworthy, and consistently structured.
Here’s a practical framework for moving from data readiness to value realization:
- Audit your current data assets. Catalog what data you have, where it lives, how it’s governed, and what quality standards apply. You cannot build on a foundation you haven’t mapped.
- Define the business question first. Big data programs that start with “we have a lot of data, let’s do something with it” rarely produce value. Start with a specific business problem: churn prediction, fraud reduction, supply chain visibility.
- Choose infrastructure that matches your scale. A mid-market company doesn’t need a petabyte-scale Hadoop cluster. Cloud-native analytics platforms offer enterprise-grade capability without the infrastructure overhead.
- Invest in data visualization tools. Raw analytical output does not drive decisions. Dashboards, scenario models, and big data visualization layers are what translate analysis into the format that executives and managers actually use.
- Embed governance from the start. Data quality, access controls, lineage tracking, and privacy compliance are not features to add later. Build them into the architecture.
- Measure value, not activity. Track the business outcomes your big data program produces: revenue impact, cost reduction, risk mitigation. If you can’t measure it, you can’t defend the investment.
Pro Tip: The most common pitfall in big data strategy is what you might call “data hoarding without purpose.” Organizations collect everything they can, build expensive pipelines, and then discover they have no clear analytical objectives. Avoid data-driven strategy mistakes by anchoring every data initiative to a specific business outcome before you write a single line of pipeline code.
My take on where big data strategy actually breaks down
I’ve spent years watching organizations pour serious budget into big data initiatives that produce dashboards nobody uses and models that never reach production. The pattern is consistent and, honestly, avoidable.
The real failure mode isn’t technical. Most organizations can buy or build adequate data infrastructure. What they cannot buy is organizational alignment between the people who understand the data and the people who make the decisions. I’ve seen brilliant data science teams produce genuinely excellent analysis that sat ignored because it was delivered in a format, or at a time, that decision-makers couldn’t connect to their actual problems.
The regulatory complexity compounds this. When I’ve worked through real-time data applications in regulated industries, the tension between moving fast and maintaining compliance isn’t just a legal headache. It shapes architecture decisions, slows deployment timelines, and forces tradeoffs that pure technology thinking never anticipates. Organizations that treat governance as an afterthought get surprised by this. Those that bake it into the design from day one find it becomes a differentiator rather than a drag.
My honest advice: stop thinking about big data as a technology program. It’s a business intelligence program that happens to require sophisticated technology. The organizations that get real value from it are the ones that start with the decision they need to make, work backward to the data that informs it, and build the simplest pipeline that gets them there reliably. Sophistication for its own sake is expensive theater.
— Colin
How Blueprysm puts big data intelligence to work for you
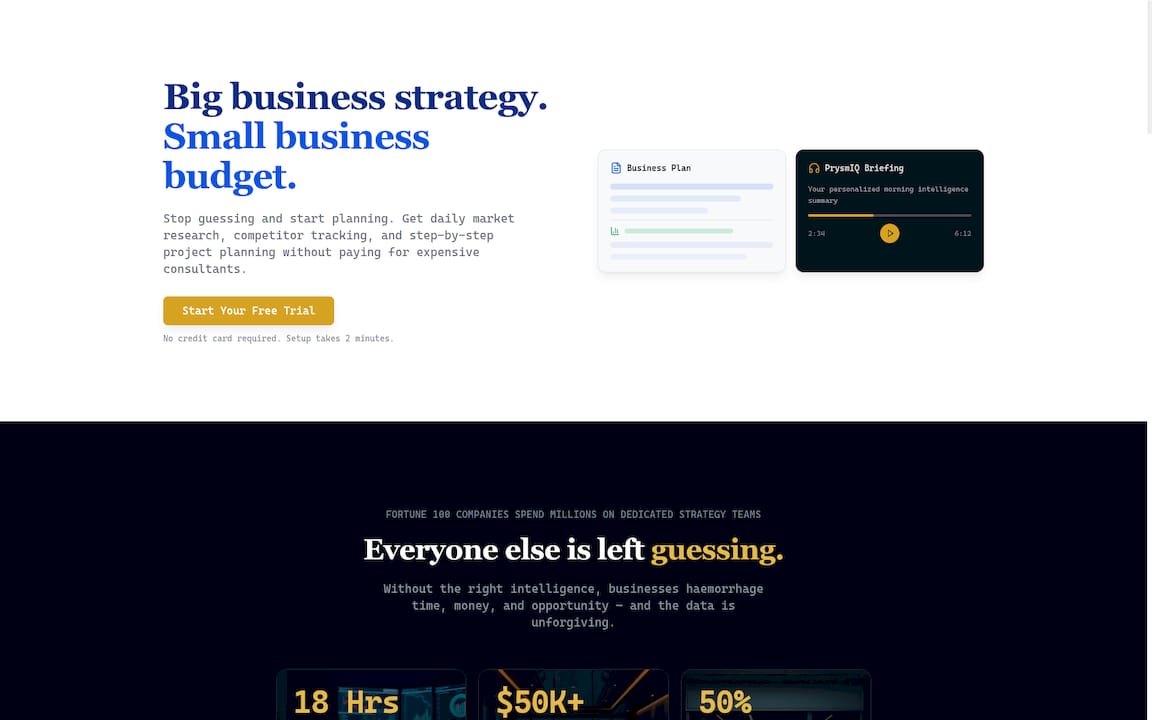
Getting big data right at the enterprise level requires resources most small and mid-sized businesses don’t have in-house. Blueprysm was built specifically to close that gap. The platform delivers AI-powered strategic intelligence, including daily market briefings, competitor monitoring, and business validation tools, without requiring a data science team or a Fortune 100 budget. You can explore how Blueprysm works to see exactly how it converts market data and competitor signals into decisions you can act on today. If you want to test whether the intelligence you’re already relying on holds up to scrutiny, the Puffery Detector is a free tool worth five minutes of your time. Big data advantage shouldn’t be reserved for the largest players. Blueprysm makes it accessible.
FAQ
What is big data, and why does it matter for business?
Big data refers to datasets characterized by high volume, velocity, variety, veracity, and value that exceed the processing capacity of traditional database tools. It matters because organizations that analyze this data effectively can detect risks, personalize customer experiences, and make faster, more accurate decisions than competitors who rely on gut instinct.
What is big data analytics?
Big data analytics is the process of examining large, complex datasets using statistical models, machine learning, and data visualization tools to uncover patterns, correlations, and insights that drive business decisions. It includes both real-time streaming analytics and batch processing for historical analysis.
How does big data visualization help decision-makers?
Big data visualization translates complex analytical output into charts, dashboards, and interactive reports that non-technical decision-makers can interpret and act on. Without strong data visualization, even accurate analysis fails to influence business decisions because the insight never reaches the people who need it.
What are the legal requirements for big data processing under GDPR?
Under GDPR Article 35, organizations must conduct a Data Protection Impact Assessment before processing personal data at scale in high-risk contexts. Non-compliance can result in fines of up to EUR 10 million or 2% of global annual turnover, and the European Data Protection Board released a standardized DPIA template in April 2026 to guide this process.
How do I start building a big data strategy for my business?
Start by identifying a specific business problem you need to solve, then audit your existing data assets for relevance and quality. Choose infrastructure proportional to your actual scale, embed governance from the start, and measure outcomes in business terms rather than technical metrics.
Recommended
- Data-Driven Strategy Examples for SMEs: Real-World Wins – Blue Prysm – Articles & Blogs
- Decision-making best practices for smarter business moves – Blue Prysm – Articles & Blogs
- Master the business decision making process for smarter growth – Articles & Blogs
- Data foundry explained: A guide for smart business leaders – Articles & Blogs