

TL;DR:
- Data mining involves analyzing large datasets to discover meaningful patterns, aiding business decision-making.
- The CRISP-DM framework guides this process through six iterative phases, emphasizing understanding and aligning with business goals.
- Effective data preparation dominates efforts, requiring careful cleaning, feature engineering, and quality checks to ensure reliable models.
Data mining is defined as the computational process of discovering patterns, anomalies, and relationships in large datasets using statistical methods and machine learning to produce actionable business insights. Think of it as the difference between staring at a spreadsheet and actually knowing what it’s telling you. For data analysts and business decision-makers, mastering this process means the difference between gut-feel strategy and decisions backed by evidence. Tools like Python’s pandas, R’s arules package, and frameworks like CRISP-DM give structure to what would otherwise be an overwhelming analytical task.
What are the main phases of the CRISP-DM data mining workflow?
CRISP-DM, which stands for Cross-Industry Standard Process for Data Mining, is the most widely adopted framework for structuring analytics projects. It works because it forces teams to define the business problem before touching a single dataset. CRISP-DM’s six phases are Business Understanding, Data Understanding, Data Preparation, Modeling, Evaluation, and Deployment. Each phase feeds into the next, and the process is explicitly iterative. Model evaluation often sends you back to data preparation or even back to reframing the original business question.
Here is what each phase demands in practice:
- Business Understanding. Define the objective in business terms, not technical ones. “Reduce churn by 10% in Q3” beats “build a classification model.”
- Data Understanding. Audit what data you have, where it lives, and whether it actually reflects the business question you just defined.
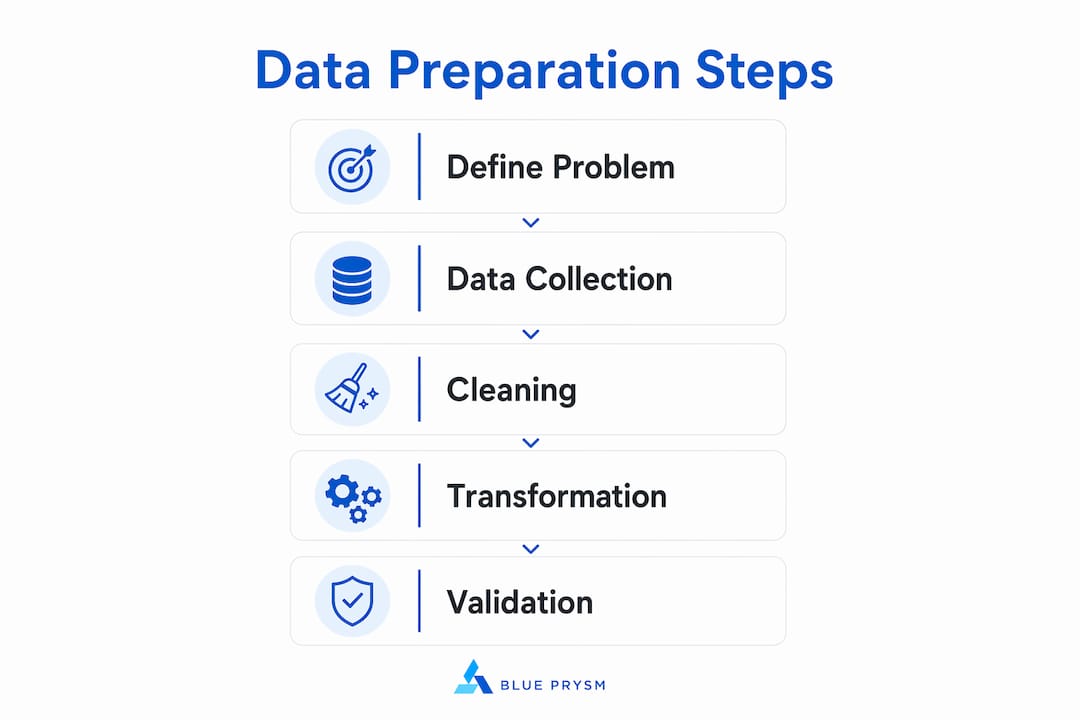
- Data Preparation. Clean, transform, and engineer features. This is where most of the work happens.
- Modeling. Select and apply techniques such as decision trees, clustering algorithms, or regression models.
- Evaluation. Test whether the model actually answers the business question. Not just whether the accuracy score looks good.
- Deployment. Integrate the model output into business operations, dashboards, or automated decision systems.
The iterative nature of CRISP-DM is its most underappreciated feature. A well-aligned analytics project revisits earlier phases regularly as new data or business context emerges. For decision-makers, this means building in review checkpoints rather than treating data mining as a one-and-done project.
Pro Tip: Before any modeling begins, write a one-paragraph business problem statement and get sign-off from the relevant stakeholder. This single step eliminates the most common cause of wasted analytics effort.
Why does data preparation consume most of your project time?
Data preparation accounts for 60 to 80% of total project effort. That number shocks most people the first time they hear it, but anyone who has worked with real-world enterprise data knows it is accurate. Raw data from CRM systems, transaction logs, and IoT sensors is rarely clean, consistent, or structured for modeling.
The core preparation tasks include:
- Cleaning: Removing duplicates, correcting typos, and standardizing formats across data sources.
- Handling missing values: Deciding whether to impute, drop, or flag gaps in the data, since each choice affects model behavior differently.
- Outlier treatment: Identifying whether extreme values represent genuine signals or data entry errors.
- Feature engineering: Creating new variables from existing ones, such as calculating customer lifetime value from transaction history.
Tools like pandas and dbt handle transformation pipelines at scale, while Apache Spark manages preparation tasks across distributed datasets. The risk of underestimating this phase is not just wasted time. Poor data quality surfaces in the evaluation phase as unexplained model failures, at which point the cost of going back is much higher.
Pro Tip: Build a data quality checklist before modeling begins. Document expected value ranges, acceptable null rates, and known data quirks for each field. This turns a reactive debugging process into a proactive quality gate.
What are the key data mining techniques and when should you use each?
Four techniques cover the majority of business use cases in data mining: association rules, clustering, classification, and regression. Choosing the wrong one for your business question wastes weeks of work.

| Technique | Key Metrics | Best Use Case |
|---|---|---|
| Association rules | Support, confidence, lift | Market basket analysis, product bundling |
| Clustering | Inertia, silhouette score | Customer segmentation, anomaly detection |
| Classification | Accuracy, precision, recall | Churn prediction, fraud flagging |
| Regression | RMSE, R-squared | Sales forecasting, pricing optimization |
Association rule mining identifies co-occurrence patterns. A retailer discovers that customers who buy diapers also buy beer on Friday evenings. That is a classic market basket result, and it directly informs shelf placement and promotional strategy.
Clustering groups records by similarity without predefined labels. K-means and DBSCAN are the workhorses here. A telecom company segments its customer base into high-value loyalists, price-sensitive switchers, and dormant accounts, then targets each group with a different retention offer.
Classification assigns records to predefined categories. Logistic regression, random forests, and gradient boosting models all fall here. A bank uses classification to flag transactions as fraudulent or legitimate in real time.
Regression predicts a continuous numerical output. A retail chain forecasts weekly sales by store using historical transactions, weather data, and promotional calendars.
Pro Tip: Match the technique to the question, not to your comfort zone. If you are asking “how many?” use regression. If you are asking “which group?” use clustering. If you are asking “what will happen?” use classification.
How do support, confidence, and lift affect association rule mining results?
These three parameters control what you find and how much of it you find. Getting them wrong means either drowning in irrelevant rules or missing the patterns that matter.
- Support measures how frequently an itemset appears in the dataset. Low support means rare patterns. High support means common ones. Setting minimum support too high filters out niche but profitable associations.
- Confidence measures the conditional probability that item B appears given item A. A rule with 90% confidence sounds compelling, but it can still be misleading if B is already purchased 88% of the time independently.
- Lift corrects for this. Rules with lift greater than 1 indicate a genuine positive association beyond chance. Lift near 1 means the items co-occur no more than you would expect randomly, making the rule useless for decision-making.
The R arules package apriori function ships with default thresholds of support 0.1 and confidence 0.8. These are starting points, not standards. A grocery chain with millions of transactions needs much lower support thresholds to surface meaningful niche patterns. An analyst who accepts defaults without questioning them will either miss important rules or generate thousands of irrelevant ones.
Small threshold adjustments can change rule output dramatically. Treat tuning as a deliberate analytical decision, not a technical afterthought.
What business problems does data mining solve across industries?
Data mining turns raw signals into strategic intelligence by enabling organizations to understand past behavior, describe current conditions, and predict future outcomes. The applications span every major sector.
- Retail and e-commerce: Product recommendation engines, inventory optimization, and promotional targeting using clustering and association rules.
- Financial services: Credit scoring, fraud detection, and portfolio risk modeling using classification and anomaly detection.
- Healthcare: Patient readmission prediction, drug interaction discovery, and claims fraud identification.
- Supply chain: Demand forecasting, supplier risk scoring, and logistics route optimization using regression models.
- Marketing: Customer lifetime value modeling, churn prediction, and campaign response scoring.
For a deeper look at how big data analytics connects to strategic business advantage, the pattern is consistent across industries. The organizations that win are not the ones with the most data. They are the ones that extract the clearest signals from it and act on them faster than competitors.
Key takeaways
Effective data mining requires structured methodology, disciplined data preparation, and deliberate alignment between technical choices and business objectives.
| Point | Details |
|---|---|
| Start with CRISP-DM | Define the business problem before selecting any technique or touching any data. |
| Budget for data preparation | Expect 60 to 80% of project effort to go into cleaning, transforming, and engineering features. |
| Match technique to question | Use regression for forecasting, clustering for segmentation, and classification for prediction tasks. |
| Tune association rule thresholds | Treat default support and confidence values as starting points and adjust based on your data and goals. |
| Lift beats confidence alone | Rules with lift greater than 1 identify genuine associations. High confidence with lift near 1 misleads decision-makers. |
Why business understanding is the step most analysts skip
I have reviewed dozens of data mining projects that failed not because of bad models, but because nobody agreed on what the model was supposed to answer. The analyst built something technically impressive. The business stakeholder wanted something completely different. Both parties assumed the other understood the objective.
CRISP-DM exists precisely to prevent this. But in practice, the Business Understanding phase gets compressed into a 30-minute kickoff call and a vague brief. The real work of translating a business goal into a precise analytical question takes time and back-and-forth that most project timelines do not budget for.
My honest advice: spend twice as long on Business Understanding as feels comfortable. Write the success criteria down. Define what a good model output actually looks like in operational terms, not just in accuracy metrics. And when the evaluation phase reveals that your model answers the wrong question, treat that as useful information rather than a failure. That is the iterative process working exactly as designed.
The analysts and decision-makers I have seen get the most value from data mining are the ones who treat it as a conversation between technical capability and business context, not a one-way delivery of model outputs.
— Colin Bowdery
How Blue Prysm supports your data mining workflow
Running a structured data mining workflow takes more than good intentions. It takes the right infrastructure for data preparation, analysis, and translating model outputs into decisions your team can act on.
Blue Prysm gives small and mid-sized businesses access to AI-driven analytics tools that align directly with CRISP-DM phases, from data analytics alignment through to deployment and monitoring. You get real-time market briefings, competitor signals, and a strategy library built for decision-makers who need answers, not raw outputs. No six-figure consulting retainer required. See how it all fits together on the Blue Prysm platform and find out what structured intelligence looks like when it is built for your scale.
FAQ
What is data mining in simple terms?
Data mining is the process of analyzing large datasets to discover patterns, relationships, and anomalies that inform business decisions. It uses statistical methods and machine learning techniques to turn raw data into usable intelligence.
What is the CRISP-DM framework?
CRISP-DM is a six-phase iterative methodology covering Business Understanding, Data Understanding, Data Preparation, Modeling, Evaluation, and Deployment. It is the most widely adopted framework for structuring data mining projects because it aligns technical work with business objectives from the start.
Why does data preparation take so long?
Data preparation consumes 60 to 80% of project effort because real-world data is rarely clean, consistent, or structured for modeling. Tasks like deduplication, missing value handling, outlier treatment, and feature engineering all require careful judgment, not just automation.
What is lift in association rule mining?
Lift measures whether two items co-occur more than chance would predict. Rules with lift greater than 1 represent genuine positive associations, while lift near 1 means the co-occurrence is essentially random and not useful for decision-making.
What data mining software do analysts use most?
Python with pandas and scikit-learn, R with the arules package, and Apache Spark for distributed processing are the most common tools. Platforms like Databricks provide end-to-end environments for big data analytics at scale.