
Capability mapping is the practice of charting what an organization can do, independent of who does it or how, so leaders can point investment at the gaps that actually determine strategy. The payoff is simple: it turns strategy from a slide deck into a prioritized list of funding decisions. TOGAF’s guidance on business capabilities and the IIBA’s BABOK both treat it as a core planning discipline, not a whiteboard exercise.
TL;DR:
- Capability maps should have 8 to 15 top-level domains to ensure readability and practical maintainability.
- Building the map with leadership input first, followed by validation with subject matter experts, accelerates the process to hours rather than months.
- Heatmapping capabilities helps prioritize investments based on strategic importance, current maturity, and underlying systems involved.
- Assigning clear ownership and establishing a governance process prevent maps from becoming outdated or irrelevant over time.
- A capability map functions best as an entry point for broader enterprise architecture once system complexity and regulatory requirements demand deeper analysis.
What Is a Business Capability, and How Does a Capability Map Differ From a Process Map?
A business capability is something an organization can do, described as a stable noun phrase like “customer onboarding” or “order fulfilment,” not a verb chain describing how it happens today. Capabilities stay put even when the org chart shakes up. A business capability model shows those capabilities and their relationships as a structured hierarchy, mostly independent of current processes or reporting lines.
That independence is the whole point, and it’s the part most teams get backwards.
- A process map shows steps in sequence: receive order, check inventory, pick, pack, ship.
- An org chart shows who report to whom.
- A capability map shows what the business needs to be able to do, regardless of which team or system currently does it.
Take “customer onboarding.” As a capability, it stays the same whether you onboard five customers a month by hand or five thousand through automated workflows. The process underneath can change completely; the capability name does not. That stability is why capability maps survive reorganizations, mergers, and system replacements, while process diagrams age out in months.
What Do Capability Maps Actually Let Leaders Do?
A capability map earns its place on the boardroom wall when it starts driving decisions instead of decorating them. Here’s what changes once you have one:
- Align business and IT around one shared vocabulary. Instead of finance calling something “billing” and engineering calling it “invoicing,” everyone points at the same capability box.
- Prioritize investment with evidence instead of instinct. You fund the capabilities tied to strategic goals and starve the ones that aren’t, rather than funding whoever asks loudest.
- Expose duplication and unclear ownership. When three business units each run their own version of “supplier management,” the map makes that redundancy impossible to ignore.
- Guide high-stakes moments. Mergers, tech consolidation, and product line expansion all move faster when both sides can compare capability inventories instead of comparing org charts that don’t map to each other.
The IIBA’s BABOK is blunt about the catch: capability analysis only works with genuine cross-functional collaboration. Build the map in a silo and it becomes shelf-ware within a quarter.
How Should You Structure and Level a Capability Map?
The most common failure in capability mapping isn’t a missing capability. It’s a map that’s too granular to read and too unstable to maintain. Structure fixes that before it starts.
- Level 1: a moderate number of domains. This is the top layer executives actually look at. Fewer than eight and you’re missing something; more than fifteen and nobody can hold the whole map in their head.
- Level 2 and 3: decompose only where decisions require it. Practical guidance from Archilu’s capability mapping framework recommends two to three levels total, and warns against pushing decomposition further before anyone has actually used the map.
- Stratify by role, not by department. Group capabilities into customer-facing, core, and enabling layers. Customer-facing capabilities touch the market directly; core capabilities run the operating engine; enabling capabilities (HR, finance, IT) keep the lights on.
- Name each capability once, and name it consistently. The IIBA notes that a capability should appear a single time on the map even if five business units each perform a version of it. Naming conventions should use noun phrases, avoid verbs, and avoid system or team names.
- Enforce mutual exclusivity. If two boxes on your map could plausibly contain the same activity, merge them or redraw the boundary. Overlap is where maps quietly become unreadable.
Discipline here is what separates a capability map that lasts three years from one that gets rebuilt every six months.
How Do You Build Your First Capability Map? A Step-by-Step Process
You don’t need a six-month consulting engagement to get a usable first draft. You need one clear afternoon, the right people in the room, and a sequence that doesn’t skip steps.
- Clarify scope and the strategic outcome you’re mapping toward. Are you prioritizing next year’s budget? Preparing for an acquisition? Evaluating a tech consolidation? The scope changes which capabilities matter most.
- Seed Level 1 top-down with leadership. Get five to eight senior stakeholders in a room and draft the 8 to 15 top-level domains before anyone starts arguing about Level 3 detail. This single step prevents the meeting from collapsing into a debate about org charts.
- Validate and decompose bottom-up with subject matter experts. Break into focused sessions per domain and let the people who actually run the work refine Level 2, decomposing to Level 3 only for capabilities under active strategic scrutiny.
- Assign an owner to every Level 1 domain and every major Level 2 capability, and capture which systems currently support each one. Ownership without a name attached is the single fastest way for a map to go stale.
- Heatmap the map against dimensions like strategic importance and current maturity, then prioritize the gaps that combine high importance with low maturity.
- Embed the map into your planning cadence. Link it to your roadmap, your budget cycle, and your OKR reviews so it gets revisited, not filed away.
Pro Tip: Run steps 2 and 3 on separate days. Mixing leadership seeding and SME validation in the same session almost always drags the conversation down into process detail before the top-level structure is locked.
One workshop insight worth stealing: teams that seed Level 1 from leadership first and then run tight, focused SME sessions to decompose only the domains under active discussion can walk out with a usable first map in hours, not months, according to Archilu’s capability mapping guide.
How Do You Heatmap and Cross-Map Capabilities to Strategy?
A capability map without a heatmap is a diagram. A capability map with a heatmap is a decision tool. TOGAF’s own guidance treats heatmapping as the technique that aligns IT investment with strategic priority, scoring each capability against dimensions that matter to leadership.
- Strategic importance: how much this capability matters to the next two to three years of strategy.
- Current maturity: how well the organization performs this capability today, on a simple 1 to 5 scale.
- Cost and risk: what it costs to run or fix, and what breaks if it fails.
Cross-mapping takes the exercise a step further by connecting capabilities to value streams and to the application portfolio behind them, a pattern also visible in Salesforce’s reference architecture diagrams for linking business drivers to technical components. Once a capability shows up as high importance and low maturity, and cross-mapping reveals three overlapping legacy systems behind it, the decision writes itself: invest, retain, or deprecate.
Scoring consistency beats scoring precision. A simple, calibrated rubric that every team applies the same way produces a far more useful heatmap than an elaborate scoring model nobody agrees on, a point TOGAF’s practitioner guidance makes explicitly.
Who Should Own the Capability Map, and How Do You Keep It Current?
A capability map that nobody owns decays fast. Governance is what keeps the map trustworthy instead of decorative.
- Assign a named, accountable owner to each Level 1 domain, and to any Level 2 capability important enough to appear on a heatmap.
- Set a change control process. New capabilities, mergers, or splits should go through a lightweight approval step, not a silent edit.
- Align the review cadence with budget and roadmap cycles. Quarterly is common; annual is the bare minimum if the map feeds strategic planning.
- Keep three living artifacts: a scoring rubric, a short charter defining scope and ownership rules, and a change log tracking what moved and why.
Skipping governance is how a sharp, well-built map from a great workshop turns into an outdated PDF by the following year.
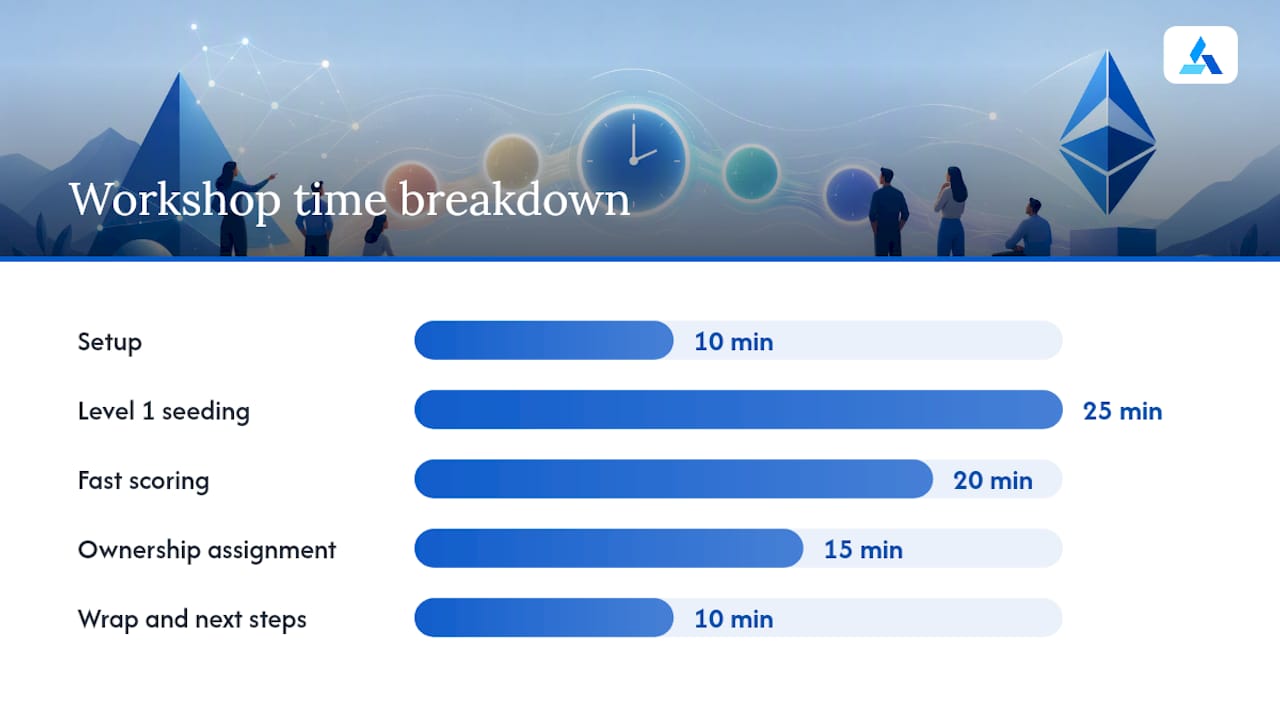
What Does a 60 to 90 Minute Capability Mapping Workshop Look Like?
A tight agenda beats a long one. Here’s a structure Blue Prysm recommends for a first working session, with clear roles assigned before anyone walks in the door.
- Setup (10 minutes): facilitator confirms scope and strategic outcome; scribe sets up the shared canvas; capability owners are pre-identified where possible.
- Level 1 seeding (25 minutes): leadership drafts 8 to 15 top-level domains, facilitator enforces mutual exclusivity in real time.
- Fast scoring (20 minutes): each domain gets a quick 1 to 5 rating on strategic importance and maturity, using a pre-agreed rubric to keep the group calibrated rather than debating each score for ten minutes.
- Ownership assignment (15 minutes): every domain gets a named accountable owner before the room breaks up.
- Wrap and next steps (10 minutes): scribe confirms outputs, facilitator schedules the SME decomposition sessions.
The most common trap Colin Bowdery flags in these sessions is letting Level 1 seeding drift into process debate. The fix is procedural, not personal: redirect any “but how do we actually do this” comment to the decomposition session, not the seeding session.
Pro Tip: If consensus stalls on where a capability belongs, table it and move on. A parking lot list resolved in the next session beats a stalled workshop every time.
What Do Capability Maps Look Like Across Different Industries and Company Sizes?
A ten-person software startup and a regional manufacturer will draw very different maps, even though the discipline underneath is identical.
A small SaaS company’s Level 1 map might run closer to eight domains: product management, customer onboarding, subscription billing, customer support, and a handful of enabling functions like finance and people operations. At that size, one person often owns two or three domains, and the map doubles as a hiring and role-clarity tool as much as a planning one.
A mid-sized manufacturer typically needs the full 8 to 15 domain range, split cleanly across customer-facing capabilities (order management, customer service), core capabilities (production planning, quality management, supply chain), and enabling capabilities (finance, HR, IT). Because physical supply chains carry more operational risk, heatmap scoring tends to weight risk and cost more heavily than a software company would.
A financial services firm’s map usually adds a fourth stratification layer for regulatory and compliance capabilities, since risk management and compliance monitoring often function as distinct strategic domains rather than enabling functions buried under “operations.” The naming conventions stay consistent across all three: noun phrases, no system names, no verbs.
What doesn’t change across industry or size is the discipline behind the map: stable capability names, disciplined levels, and a heatmap that actually drives a funding decision.
What Tools and Software Work Best for Building a Capability Map?
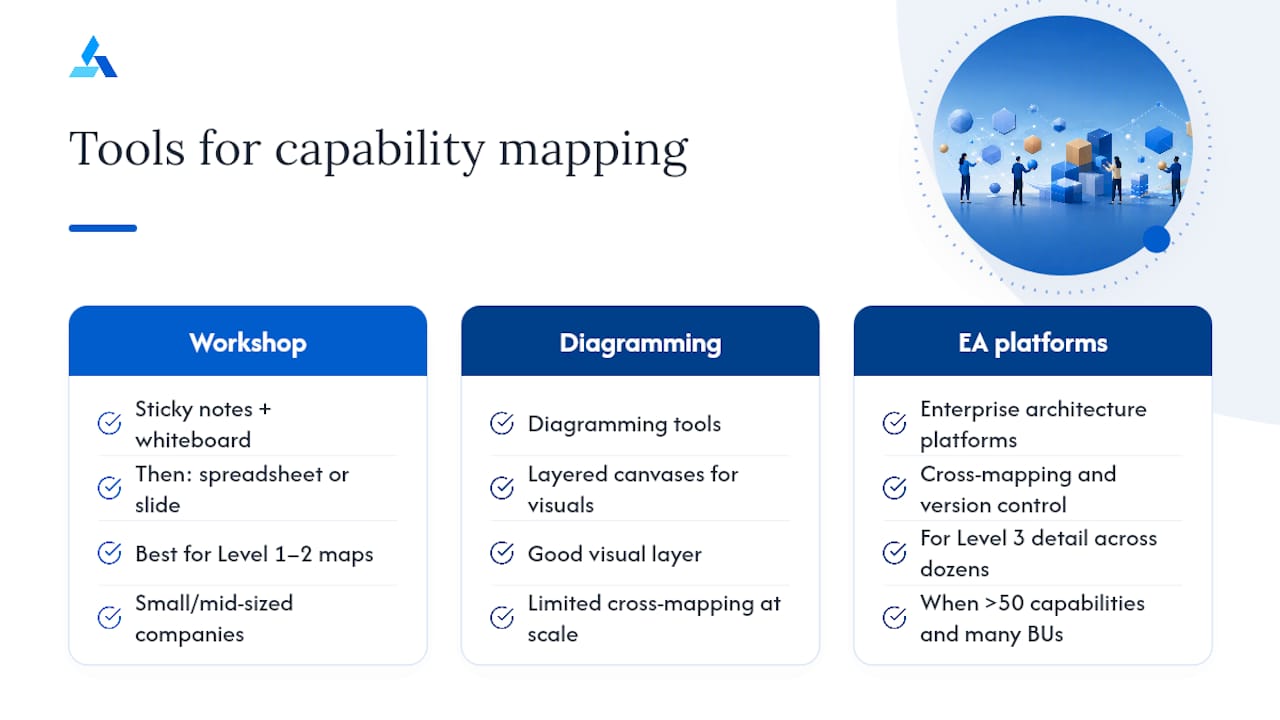
You don’t need enterprise architecture software to build a first capability map. A workshop with sticky notes and a whiteboard, later transferred into a spreadsheet or a slide, produces a perfectly usable Level 1 and Level 2 map for most small and mid-sized companies.
Where dedicated software earns its cost is at scale: when you’re maintaining Level 3 detail across dozens of capabilities, cross-mapping to a large application portfolio, or running heatmaps that need to update automatically as maturity scores change quarter over quarter. Diagramming tools with layered canvases work well for the visual layer. Enterprise architecture platforms add the cross-mapping and version control that a spreadsheet can’t handle once the map involves more than fifty capabilities and multiple business units editing it.
The harder problem most tools don’t solve is what happens after the map exists: connecting capability gaps to actual competitive context and market timing. A capability map tells you that “digital customer engagement” is a weak, strategically important domain. It doesn’t tell you what competitors are doing in that space right now or whether the market window is closing. That’s a different kind of tool entirely, one built for ongoing market intelligence rather than static architecture diagrams, and it’s worth pairing the two rather than treating capability software as the whole solution.
When Is a Capability Map Enough, and When Do You Need Full Enterprise Architecture?
A capability map solves alignment and quick prioritization problems: budget season disputes, “who owns this” confusion, a first pass at merger overlap. It’s not enough once you’re dealing with deep system integrations, hard regulatory constraints, or multi-year transformation programs with dependencies across dozens of applications. At that point, stage the map as the front door into a fuller enterprise architecture practice, built on frameworks like TOGAF, rather than trying to stretch a whiteboard exercise into something it was never designed to carry.
— Colin Bowdery
How Blue Prysm Turns Your Capability Map Into a Live Roadmap
A capability map tells you where the gaps are. Blue Prysm is what keeps that map from going stale the moment the workshop ends. Instead of a static diagram that someone has to remember to update, Blue Prysm connects your prioritized capabilities to real-time market analysis, competitor tracking, and a business strategy framework library with more than 50 templates, so the gaps you heatmapped in the workshop turn into an actual roadmap with owners and deadlines.
If you want to see what that looks like before committing to anything, check a sample intelligence briefing or review a sample venture analysis built on the same logic your capability map runs on. For teams that need a facilitator in the room rather than a self-serve tool, Blue Prysm also runs Corporate & Growth Strategy engagements that include capability mapping workshops as part of the scope. On the software side, the Starter plan runs $30 per month or $299 per year, and Pro runs $149 per month or $1,499 per year, both detailed on the Blue Prysm pricing page. If capital is the constraint standing between your prioritized capabilities and funded initiatives, it’s also worth looking at practical ways to structure business loans around the specific investments your map just surfaced.
Sources
- Governance
- 10.6 Business capability analysis | IIBA® BABOK
- Business capability mapping guide | Archilu
- Business capability model — Wikipedia
FAQ
Can you give an example of a business capability?
“Customer onboarding,” “order fulfilment,” and “supplier management” are all business capabilities: stable noun phrases describing what an organization can do, regardless of which team or system performs the work today.
How do you build a capability framework?
Seed a Level 1 structure of 8 to 15 domains with leadership, validate and decompose it with subject matter experts, assign named owners to each domain, then heatmap the results against strategic importance and maturity to prioritize investment.
What is a business capability map, and what is its purpose?
A business capability map is a structured, graphical view of everything an organization can do, arranged in a stable hierarchy independent of current processes or org charts, according to the business capability model. Its purpose is to align business and IT around a shared vocabulary and turn strategy into prioritized funding decisions.
How many capabilities should a Level 1 map have?
Most practical guidance recommends 8 to 15 top-level domains, enough to cover the business without becoming unreadable, with deeper decomposition reserved for capabilities under active strategic scrutiny.
Does Blue Prysm help with capability mapping?
Blue Prysm’s platform and Corporate & Growth Strategy consulting engagements connect a completed capability map to real-time market data and competitor tracking, turning heatmapped gaps into a funded, monitored roadmap rather than a static diagram.