
Good marketing OKRs measure outcomes, not activity. Pipeline influence, revenue contribution, retention, and brand lift are the only categories worth putting a target on. The workable structure is one to three objectives per quarter, each with two to four measurable key results, tracked weekly and scored honestly at the midpoint. The categorized examples below give you a starting template for every major marketing function.
TL;DR:
- Marketing OKRs should focus on measurable outcomes like pipeline contribution, revenue impact, or customer retention, not activity metrics like content volume or impressions.
- Key Results must include specific numbers with baselines and targets that tie directly to revenue or pipeline goals, avoiding vanity metrics.
- Regular weekly check-ins and mid-cycle scoring are essential to keep OKRs alive and to identify issues early, rather than relying solely on end-of-quarter reviews.
- Cross-functional OKRs should involve stakeholders from sales, product, and finance from the start to ensure alignment and realistic targets.
- Using dedicated tools that connect OKRs with market insights and competitive intelligence can improve tracking and help maintain focus throughout the quarter.
Why Set OKRs for Marketing Teams Instead of Just Chasing Activity?
Most marketing teams don’t have a goal problem. They have a measurement problem dressed up as a goal. “Increase blog traffic 20%” and “publish 12 pieces of content” both sound like objectives, but neither tells you whether the business is better off. That’s the activity trap: it rewards output, not impact.
A strong marketing OKR passes a simple test: would a CEO recognize it as commercially significant? If the answer is no, the metric probably belongs on an internal dashboard, not on the quarterly scorecard, according to the OKR Institute. “We published 40 blog posts” doesn’t clear that bar. “Organic search drove $180,000 in sourced pipeline” does.
This is where metric tiers earn their keep. Tier one metrics, like contribution margin after marketing spend or blended LTV to CAC, belong in front of leadership because they answer the only question executives actually care about: is marketing spend paying off? Tier two metrics, like channel ROAS or cost per qualified lead, guide the operational budget calls marketing managers make every week. Tier three metrics, like impressions or social followers, are diagnostic at best and dangerous when they get mistaken for headline indicators, a distinction HubSpot’s guidance on optimizing performance metrics makes explicitly.
Tying OKRs to the right tier changes how the whole team operates:
- Prioritization gets sharper. When the objective is “grow pipeline-qualified demand,” a campaign idea either serves that goal or it doesn’t. No more debating whether a rebrand matters more than a lead-gen push based on gut feeling.
- Resource allocation stops being political. Budget conversations move from “who asked loudest” to “which channel is closest to its target.”
- Executive credibility rises. A marketing leader who reports pipeline dollars and CAC trends earns a different kind of trust in the boardroom than one who reports page views.
- Measurement becomes a shared language. Sales, finance, and marketing can argue about strategy, but they stop arguing about what “success” means.
None of this requires more data. It requires picking the right numbers and refusing to let vanity metrics wear an outcome’s clothes.
How Do You Write a Marketing OKR That Actually Works?
The template is simple on paper and hard in practice: one qualitative Objective, paired with two to four quantitative Key Results that each move from a baseline to a target within the quarter. John Doerr’s original framing still holds up: objectives should be aspirational, and key results should be so measurable that a stranger could grade them without asking you what you meant, a point Harvard Business Review’s breakdown of Doerr’s method lays out clearly.
Here’s the structure to copy:
- Objective: A short, qualitative statement of what “winning” looks like this quarter. Example: “Become the primary demand engine for enterprise pipeline.”
- Key Result 1: A number with a baseline and a target. Example: “Increase marketing-sourced pipeline from $1.2M to $2.1M.”
- Key Result 2: A different dimension of the same objective. Example: “Raise MQL-to-SQL conversion rate from 18% to 28%.”
- Key Result 3 (optional): A guardrail metric that prevents gaming the first two. Example: “Keep cost per SQL under $340.”
- Owner and confidence: Assign a single accountable owner per KR and log a starting confidence score, typically calibrated around 70%, so nobody starts a quarter pretending a stretch goal is a sure thing.
A few rules of thumb keep this from sliding back into busywork. Cap it at two to four KRs; five or more usually means you’re tracking tasks, not outcomes. Scope everything to a single quarter; anything longer stops functioning as a forcing function. And apply this filter to every KR before it goes on the board: “Ship the new landing page” is a task. “Increase demo requests from the new landing page from 40 to 90 per month” is a key result. The first tells you what you did. The second tells you whether it worked.
Mix lead and lag indicators inside each objective. A lag indicator, like closed-won revenue, tells you the outcome. A lead indicator, like sales-accepted leads or content engagement depth, gives you an early warning if the lag metric is about to disappoint. Wherever possible, anchor at least one KR per objective to a revenue or pipeline number rather than a channel-level number, since channel metrics can improve while the business impact stays flat. Brand and operational KRs, like unaided brand recall or campaign turnaround time, still belong in the mix, but they should support a revenue-tied objective rather than stand alone as the whole quarter’s ambition.
Pro Tip: Write the Key Result before you write the Objective. If you can’t state a specific number moving from A to B, the Objective is still too vague to act on.
Governance is what keeps a well-written OKR from decaying into a forgotten slide by week six. Three rituals matter more than any others: a weekly check-in where each owner reports status, a mid-cycle scoring session around week six or seven where the team grades progress honestly instead of optimistically, and a retrospective at quarter’s end that asks not just “did we hit it” but “should this KR exist again next quarter.” Analysis of real-world marketing OKRs found that more than half of the key results teams write are tasks or KPIs wearing an outcome’s disguise, and that outcome-based KRs paired with weekly governance meaningfully raise completion rates, according to OKRSTool’s review of 30-plus marketing OKR examples.
Practical OKR Examples for Every Marketing Function
Every function needs a different flavor of outcome, but the discipline is identical: pick a KR a CEO would care about, give it a baseline and a target, and name an owner. Here’s a starting set to adapt with your own numbers.
Demand generation lives closest to revenue, so its KRs should say so directly.
- Objective: Build a predictable pipeline engine for the enterprise segment.
- KR1: Increase marketing-sourced pipeline from $900K to $1.6M.
- KR2: Improve MQL-to-SQL conversion from 22% to 32%.
- KR3: Reduce cost per sales-accepted lead from $210 to $160.
Content and SEO teams get judged on traffic too often, so anchor the objective to what that traffic actually produces.
- Objective: Turn organic search into a qualified demand channel, not just a traffic source.
- KR1: Grow organic sessions from qualified buyer segments from 12,000 to 20,000 monthly.
- KR2: Increase demo requests attributed to organic content from 45 to 90 per month.
- KR3: Move first-touch attribution share for closed-won deals from 15% to 25%.
Paid media already runs on numbers, so the trap here isn’t vague goals, it’s optimizing for the wrong number.
- Objective: Make paid acquisition efficient enough to scale without diminishing returns.
- KR1: Improve blended ROAS from 2.4x to 3.5x.
- KR2: Reduce cost per qualified opportunity from $480 to $320.
- KR3: Hold CAC by channel within 10% of the finance-approved target across all active channels.
Brand and PR work is the hardest to tie to revenue, which is exactly why the KRs need to be specific rather than aspirational.
- Objective: Convert brand visibility into a measurable pipeline contributor.
- KR1: Increase branded search volume from 8,500 to 13,000 monthly queries.
- KR2: Generate 15 earned media placements that produce at least 200 trackable MQLs combined.
Product marketing should be judged on whether launches sell, not on whether they ship on time.
- Objective: Make every product launch a pipeline event, not a press release.
- KR1: Generate $500K in launch-qualified pipeline within 60 days of release.
- KR2: Raise sales enablement content usage rate from 40% to 75% of reps within the first month.
Lifecycle and retention OKRs protect the revenue marketing already earned.
- Objective: Turn existing customers into a growth channel, not just a renewal line item.
- KR1: Increase expansion revenue influenced by lifecycle campaigns from $220K to $400K quarterly.
- KR2: Reduce logo churn in the target segment from 6% to 4%.
Social and community teams need KRs that connect engagement to a business action, not just a follower count.
- Objective: Turn community engagement into a qualified pipeline source.
- KR1: Generate 60 demo requests attributed to social channels, up from 25.
- KR2: Enroll 40 accounts in community-driven product pilots, up from 15.
| Function | Sample objective focus | Primary KR type | Typical owner |
|---|---|---|---|
| Demand generation | Pipeline predictability | Revenue and conversion rate | Demand gen lead |
| Content & SEO | Qualified organic demand | Attributed conversions | Content/SEO lead |
| Paid media | Acquisition efficiency | ROAS and CAC | Paid media manager |
| Brand & PR | Visibility to pipeline | Branded search and earned MQLs | Brand lead |
| Product marketing | Launch performance | Launch-qualified pipeline | Product marketing lead |
| Lifecycle & retention | Expansion and churn | Expansion revenue, churn rate | Lifecycle marketing lead |
| Social & community | Community-to-pipeline | Demo requests, pilot enrollments | Social/community lead |
None of these numbers are universal targets. They’re placeholders to replace with your own baseline. What travels across every function is the shape: an outcome statement, a number that starts somewhere specific and ends somewhere specific, and a name attached to it.
How Do You Track Marketing OKRs Through the Quarter?
An OKR that’s only reviewed at quarter’s end isn’t a management tool, it’s a postmortem. The cadence that keeps OKRs alive has three checkpoints.
- Weekly check-ins. Keep these short: what moved this week, what’s at risk, and what’s the single next priority for each KR owner. Fifteen minutes per objective is usually enough once the habit is set. The point isn’t a status report, it’s an early warning system.
- Mid-cycle scoring, around week six of a twelve-week quarter. Score each KR honestly on a 0 to 1.0 scale against its target trajectory, not against how good the team feels. This is the moment to make a real decision: revise the target if the baseline assumption was wrong, escalate for resourcing if the KR is stalling for reasons outside the owner’s control, or close a KR early if it’s already been overtaken by events.
- End-of-cycle retrospective. Capture what worked, what didn’t, and which KRs deserve to carry into next quarter versus which ones served their purpose and should retire. Feed that directly into the next planning cycle instead of starting from a blank page.
Dashboards fail most often when they blend KRs with every KPI a team happens to track. Keep the dashboard tiered the same way the metrics themselves are tiered: OKR progress at the top, tier-two channel diagnostics underneath, and raw activity metrics available on request but never on the front screen. A structured cadence planning approach that separates these layers has been linked to teams completing 43% more of their planned OKRs than teams running an unstructured weekly meeting.
Weekly check-ins and mid-cycle scoring aren’t bureaucratic overhead, they’re the mechanism that catches a drifting KR in week four instead of week eleven, a pattern confirmed by OKRSTool’s analysis of marketing OKR governance.
What Mistakes Keep Marketing OKRs From Working?
Most broken OKRs fail in one of three predictable ways, and all three are fixable in a single review meeting.
The most common failure is a task wearing a KR’s clothes. “Launch the new nurture sequence” isn’t measurable progress, it’s a to-do item. Rewrite it as “Increase MQL-to-SQL conversion from the nurture sequence from 12% to 20%.” The task might still happen, but now it has a scoreboard attached.
Run every draft KR against this checklist before it goes live:
- Does it have a named owner, not a team?
- Does it start from a real baseline, not a guess?
- Does it name a specific target and a date?
- Is it tagged to the right metric tier, so leadership and operators aren’t confused about who should care?
- Does it carry an honest starting confidence score?
- Is there a fixed weekly review slot on someone’s calendar?
Siloed OKRs are the second failure mode. A demand gen objective that ignores what sales can actually work, or a content objective disconnected from what SEO is targeting, creates internal competition instead of alignment. The fix is structural: any OKR whose outcome depends on another team’s decision needs a co-owner from that team from day one, not a courtesy heads-up after the targets are set.
Pro Tip: If you can’t name the single person accountable for a KR moving, it isn’t a KR yet. It’s a wish with a number attached.
How Blue Prysm Supports Teams Running Marketing OKRs
Writing a good OKR is one problem. Keeping it alive for thirteen weeks without it quietly rotting on a slide is another. That’s usually where governance breaks down, not at the whiteboard stage.
Blue Prysm’s market research tools were built around that exact gap: real-time market insights and competitor tracking that feed directly into the KRs you’re already trying to move, rather than sitting in a separate report nobody opens. If your objective depends on knowing whether a competitor just undercut your pricing or launched into your segment, an automated competitive intelligence briefing catches that before it shows up as a missed KR three weeks later.
The platform’s strategy library gives teams a starting point instead of a blank page when they’re structuring quarterly objectives, and its execution dashboards keep KR progress visible without mixing it into every other metric the team tracks. A few concrete ways this shows up in practice:
- Weekly intelligence briefings replace the ad hoc “did anything change in the market” conversation that eats into check-in time.
- A shared scorecard view means mid-cycle scoring doesn’t require someone manually pulling numbers from five different tools.
- The strategy library gives new OKR owners a template to start from instead of reinventing the objective structure every quarter.
Colin Bowdery, who writes on strategic planning and execution for Blue Prysm, has covered related ground in a guide to OKR training for managers that walks through live facilitation practice for exactly this kind of quarterly review.
How Do You Align Marketing OKRs With Company OKRs?
Marketing OKRs that live in their own universe, disconnected from what the CEO and the board are actually tracking, tend to get deprioritized the first time budget gets tight. The fix starts upstream: before marketing drafts a single objective, someone needs to know what the company-level OKRs actually say for the quarter.
If the company objective is “expand into the mid-market segment,” marketing’s objective shouldn’t be a generic brand goal, it should be the demand-side half of that same bet: pipeline generated specifically from mid-market accounts, or trial signups from that segment’s ideal customer profile. The test is simple. Read the marketing objective out loud next to the company objective. If someone outside marketing would struggle to see the connection, the objective needs to be rewritten, not defended.

This works both directions. Marketing leadership should have visibility into sales and product OKRs before finalizing its own, and ideally sit in the room when company-level objectives are being set rather than receiving them after the fact. A look at how high-performing marketing teams structure this collaboration points to the same pattern: alignment happens in the planning meeting, not in a Slack message announcing the goals after they’re already locked.
The practical habit that sustains this: every marketing OKR document should include a one-line note stating which company OKR it supports. If that line is blank, the objective probably shouldn’t survive the planning meeting.
Who Should Be in the Room When You Set Marketing OKRs?
Marketing OKRs drafted in isolation almost always miss something sales or product could have flagged in five minutes. The MQL-to-SQL conversion target means nothing without sales weighing in on what actually counts as a qualified lead in their pipeline. A launch-pipeline KR is fiction without product marketing confirming the launch timeline is real.
Bring three groups into the setting process, not just the review afterward. Sales leadership should validate any KR that depends on lead quality or conversion definitions, since they’re the ones who’ll ultimately grade whether the number was real. Product and engineering leads need a seat when objectives depend on launch timing or feature availability, because a marketing KR tied to a shipping date that slips is a marketing failure on paper and an engineering decision in reality. And finance should sign off on any KR involving CAC, ROAS, or budget thresholds, since a target that looks aggressive to marketing might be conservative or reckless from a unit economics view finance already tracks.
Executive involvement matters differently than peer involvement. Leadership doesn’t need to approve every KR’s exact number, but they do need to see the objectives before the quarter starts, not in a mid-quarter update when it’s too late to redirect resources. A short kickoff review, even thirty minutes, where marketing presents drafted OKRs and leadership pushes back on anything too safe or too disconnected from company priorities, catches most alignment problems before they cost a quarter. Skipping that meeting is the single most common reason marketing OKRs quietly diverge from what the business actually needed.
What Tools Help You Manage Marketing OKRs Day to Day?
The tool matters less than the habit it enforces, but the wrong tool makes the habit harder to keep. A spreadsheet works fine for a five-person team running one objective. It falls apart fast once you have four functions, a dozen KRs, and a leadership team that wants a rollup without asking someone to compile it manually every Friday.
What to look for isn’t a specific product category, it’s three capabilities: a way to log a baseline and target with an owner attached, a lightweight weekly check-in flow that doesn’t feel like extra homework, and a dashboard view that separates OKR progress from the flood of other metrics a marketing team tracks. Dedicated OKR software typically handles the first two well. The gap most tools leave open is the third: connecting KR progress to the market and competitive context that explains why a number moved.
That’s the specific niche a platform like Blue Prysm’s market analysis platform fills, combining OKR and KPI tracking with the competitive intelligence that tells you whether a missed target was an execution problem or a market shift nobody flagged in time. For teams that would rather outsource channel execution entirely while keeping OKR ownership in house, a marketing agency’s published pricing structure is worth reviewing as a comparison point for what fractional execution support typically costs. Whatever tool you pick, the test is the same: does it make the weekly check-in faster, or does it become another dashboard nobody opens after week two.
How Should You Review and Improve OKRs Across Multiple Quarters?
The biggest improvement lever isn’t a better objective, it’s a better memory. Teams that treat every quarter as a fresh start repeat the same targeting mistakes because nobody wrote down what happened last time.
Build a simple habit at the end of every cycle: log the final score for each KR next to the confidence score it started with. A KR that started at 70% confidence and landed at 0.4 taught you something different than one that started at 40% confidence and landed at 0.9. Over three or four quarters, this record tells you whether your team consistently underestimates or overestimates its own targets, which matters more for planning than any single quarter’s result.
Retire objectives that have been hit two quarters running rather than repeating them out of habit. A KR that keeps getting scored at 1.0 either wasn’t ambitious enough or has stopped reflecting what actually matters to the business right now. Replace it with the next real constraint on growth, not a repeat of last quarter’s win.
Finally, revisit the metric tiers themselves every two or three quarters, not just the targets within them. A KPI that was a fair proxy for pipeline health a year ago might not be anymore if the sales motion has changed. The KPI versus metric distinction is worth revisiting whenever a KR starts feeling disconnected from what leadership actually asks about in reviews.
When Should Marketing Own an OKR Alone, Versus Share It?
The rule of thumb I’d apply here is straightforward: if the outcome depends on a decision another team makes, the OKR has to be shared, full stop. A product launch pipeline target, an enterprise ABM push, or a trial-to-paid conversion lift all fail as marketing-only goals because sales, product, or customer success control half the levers. Brand awareness and channel operations, by contrast, sit cleanly inside marketing’s control and can stay marketing-owned. Evidence on shared cross-functional OKRs backs this up directly: shared objectives outperform marketing-only ones whenever the outcome crosses a team boundary. When you do share one, name a co-owner from each team and put a joint weekly touchpoint on the calendar from week one, not week six.
— Colin Bowdery
Turn Your OKRs Into a System, Not a Slide Deck
Writing a good marketing OKR takes an afternoon. Keeping it alive for thirteen weeks, with weekly check-ins that don’t get skipped and a scorecard leadership actually trusts, is the part most teams quietly abandon by week five. Blue Prysm was built for that second problem specifically.
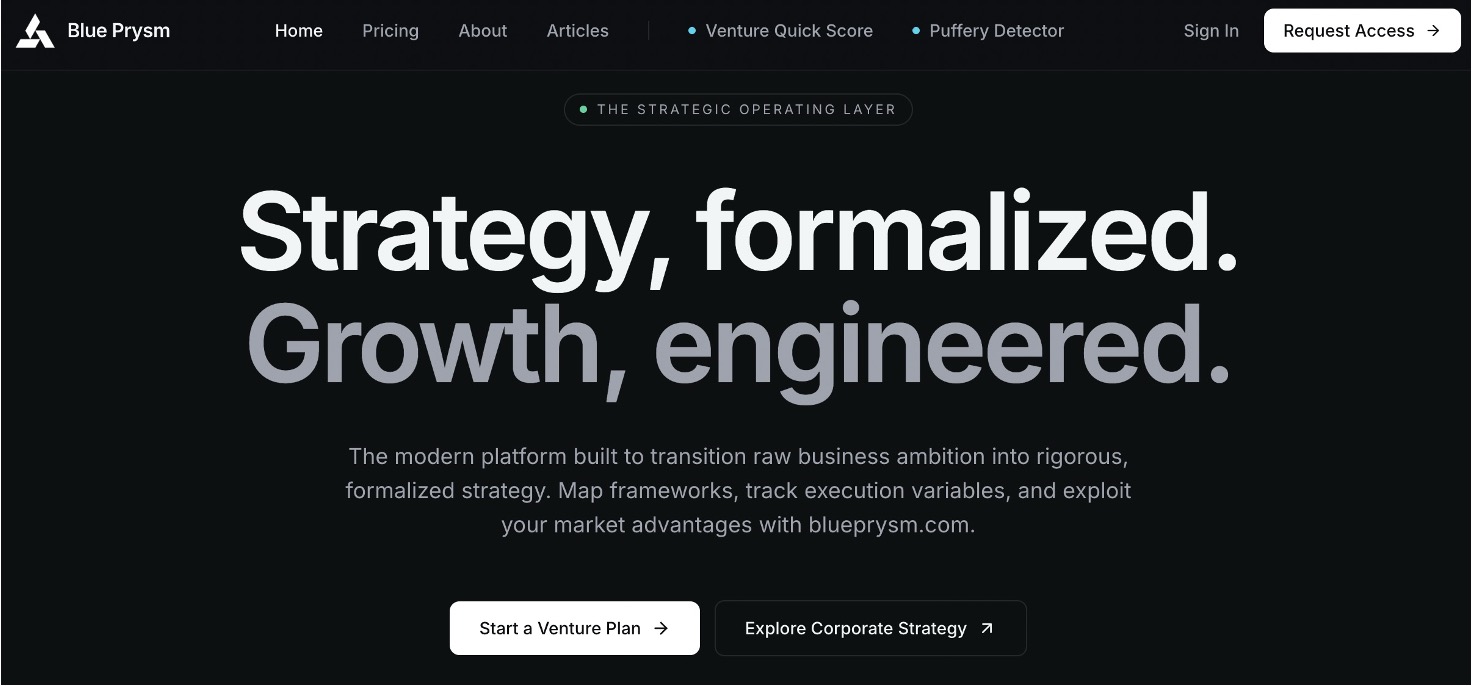
The platform’s strategy library gives you a structured starting point instead of a blank quarterly template, its automated competitive intelligence briefings feed directly into the market-context KRs you’re trying to move, and its execution dashboards keep OKR progress separate from the noise of every other metric your team tracks. If you’d rather have a strategist walk your team through setting the first cycle properly, Blue Prysm’s Framework Mastery training covers exactly that kind of live facilitation.
Plans start with the Starter tier at $30 per month or $299 per year, scale to Pro at $149 per month or $1,499 per year for growing teams, and top out at Enterprise for teams that need broader seat access and deeper governance support. This is optional next-step tooling, not a requirement to run OKRs well, but if your quarterly reviews keep sliding, it’s worth a look at the pricing page to see which tier fits your team’s cadence.
Sources
- OKR Institute — Marketing OKRs
- HubSpot — Optimizing performance metrics
- HBR — How VC John Doerr sets and achieves goals
- OKRSTool — 30+ OKR examples for marketing teams
FAQ
What Is the 3-3-3 Rule for Marketing?
The 3-3-3 rule generally refers to focusing on three priorities, over three time horizons, tracked across three key metrics, a planning shorthand some marketing teams use to avoid overloading a quarter. It isn’t a formal OKR standard, but it pairs well with the one-to-three-objectives guidance covered above, since both push teams toward fewer, sharper priorities rather than a long wish list.
What Are the 5 Elements of an OKR?
The core elements are the Objective itself, the Key Results that measure it, a baseline for each KR, a target for each KR, and an assigned owner accountable for moving it. Some teams add a confidence score as a fifth tracked element, typically calibrated around 70% at the start of the quarter, as outlined in the HBR breakdown of the OKR framework.
What Is an OKR vs. a KPI?
An OKR is a time-bound goal structure pairing a qualitative Objective with measurable Key Results meant to drive a specific outcome within a quarter. A KPI is an ongoing metric you monitor continuously, like churn rate or website traffic, without a fixed end date. Many KRs are built on top of KPIs, but not every KPI belongs in a KR, which is exactly the tiering distinction HubSpot’s metrics guidance addresses.
Are OKRs Still Relevant for Marketing Teams?
Yes, and the evidence points the other way from the skepticism: teams that pair outcome-based KRs with weekly check-ins and mid-cycle scoring see materially higher completion rates than teams tracking activity metrics loosely, according to analysis of marketing OKR examples. The framework fails when teams write tasks disguised as KRs, not because the framework itself is outdated.
How Many OKRs Should a Marketing Team Set Per Quarter?
Most marketing teams do best with one to three objectives per quarter, each carrying two to four Key Results. Beyond that, teams tend to dilute focus across too many fronts and struggle to give each objective a real weekly check-in, which is the governance step that keeps OKRs from becoming forgotten line items.