
TL;DR:
- Identifying growth opportunities involves analyzing internal signals and external market signals to find actionable expansion paths. Frameworks like Jobs-to-be-Done and the Ansoff Matrix help classify and assess these opportunities based on customer needs and strategic risk. Validating unit economics before pursuing new markets ensures that growth efforts are sustainable and profitable.
Growth opportunity identification is the disciplined process of finding actionable ways to expand revenue and market presence by analyzing customer needs, market signals, and strategic fit. Most business leaders skip the discipline and go straight to execution. That is the trap. Knowing how to identify growth opportunities before you commit capital separates businesses that scale from those that stall. The process draws on frameworks like Jobs-to-be-Done (JTBD), the Ansoff Matrix, and unit economics to turn raw market signals into ranked, investable directions.
How to identify growth opportunities from internal and external signals
The first place to look is inside your own business. Growing margins in a specific product line, inbound inquiries from customer segments you never targeted, and teams stretched beyond capacity are all signals that demand is outpacing your current strategy. These internal signals are often the clearest evidence of latent growth potential because they reflect real behavior, not hypotheses.

External signals require a wider lens. Regulatory changes can open new customer categories overnight. Shifts in customer behavior, like a move from in-person to digital purchasing, create gaps that existing players are slow to fill. Market gaps show up when customers complain publicly about what current solutions cannot do.
Combining internal and external signals builds a long list of initial directions. The goal at this stage is volume, not precision. Jumping to evaluation too early biases teams toward familiar ideas and causes them to miss less obvious but genuinely promising markets.
- Internal signals to track: margin growth by product or segment, unsolicited demand from non-target customers, team capacity strain, and repeat purchase rates
- External signals to track: regulatory shifts, competitor exits, rising search volume in adjacent categories, and customer frustration patterns in reviews
- Combining signals: map both sets side by side to find where internal strength meets external demand
Pro Tip: Use AI-powered market research tools to surface hidden patterns in customer behavior data that manual analysis routinely misses.
What frameworks reveal about finding growth potential
Two frameworks do the heavy lifting when it comes to growth opportunity analysis: Jobs-to-be-Done and the Ansoff Matrix. Used together, they give you both a customer lens and a strategic lens.
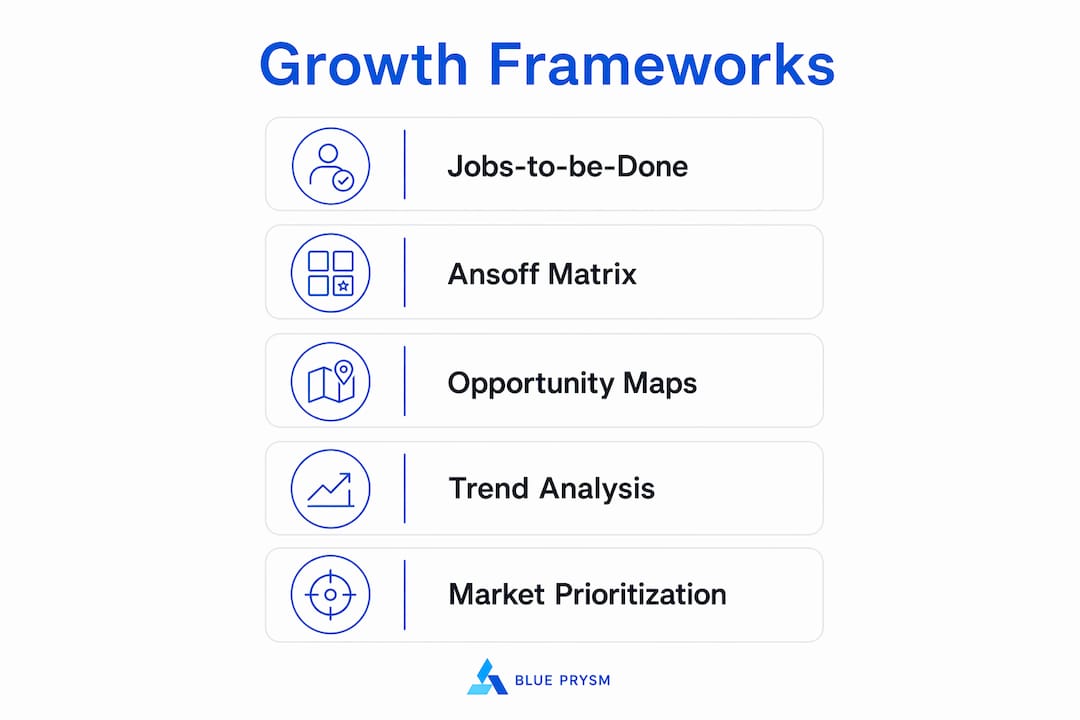
The JTBD framework reveals underserved customer needs hidden in the “jobs” that broad market research misses. A job is what a customer is actually trying to accomplish, not just the product they buy. A small business owner who buys accounting software is not buying software. They are buying peace of mind before tax season. When you map the full job, you often find adjacent needs that no current product addresses well. Those gaps are growth opportunities.
The Ansoff Matrix classifies growth strategies by risk level:
- Market penetration: Sell more of your existing product to your existing market. This is the lowest-risk option and the right starting point for most businesses.
- Market development: Take your existing product into new geographies or customer segments. Geographic expansion into proven customer profiles carries lower risk than entering new verticals without validated product-market fit.
- Product development: Build new products for your existing customer base. This works best when you have strong customer relationships and clear unmet needs.
- Diversification: Enter new markets with new products. This is the highest-risk quadrant and requires the most rigorous validation before investment.
Opportunity maps and trend analysis sharpen your focus further. Plot identified opportunities against your current capabilities and the competitive intensity of each space. The opportunities that sit in high-demand, low-competition zones with strong alignment to your existing strengths are the ones worth pursuing first.
How to evaluate market potential with unit economics
Theoretical market size is a vanity metric. A market worth $10 billion means nothing if your unit economics do not work. Moving beyond market size to active demand indicators is the step most leaders skip, and it is the one that saves the most money.
The core unit economics to model are customer acquisition cost (CAC), average order value (AOV), and retention rate. If your CAC exceeds your AOV in the first transaction and your retention rate is low, the opportunity is not viable regardless of how large the Total Addressable Market appears. Run the numbers before you run the pilot.
Demand validation methods give you real signal before you invest:
| Validation method | What it tells you |
|---|---|
| Search volume trends | Whether active demand exists and is growing |
| Inbound inquiry volume | Whether your current positioning already attracts this segment |
| Behavioral data analysis | How customers navigate toward or away from a solution |
| Customer interviews | What job they are actually trying to accomplish |
Pro Tip: Before modeling a new market, check whether your existing customer data already contains behavioral signals pointing toward the opportunity. Owned data is faster and cheaper than primary research.
Prioritizing existing products and customer bases to find latent revenue is frequently the lowest-risk growth strategy. You already paid to acquire those customers. Mining that relationship for adjacent needs costs far less than acquiring new ones in an unproven segment.
How to prioritize growth opportunities using a scan and sift process
A disciplined scan and sift process prevents the most common mistake in growth planning: narrowing your focus before you have seen enough options. The scan phase is deliberately broad. You gather every plausible direction without filtering. The sift phase applies criteria to rank them.
The sift criteria that matter most:
- Market size: Is the addressable segment large enough to justify the investment?
- Competitive intensity: How many well-resourced players already own this space?
- Ease of entry: Do you have existing relationships, assets, or capabilities that reduce the cost of entry?
- Profit potential: Do the unit economics work at realistic scale?
- Strategic fit: Does this direction reinforce or distract from your core business?
Weight these criteria based on your company’s specific context. A capital-constrained startup should weight ease of entry and profit potential heavily. A well-funded business with a strong brand can afford to weight market size more aggressively.
A proven three-step sequence minimizes risk by starting with market penetration in segments with strong Product-Market Fit, then moving to geographic expansion, and only then considering vertical expansion with validated customer data. This sequence reduces the time and capital needed to confirm whether an opportunity is real.
The most common pitfall is letting gut feel or organizational familiarity drive the ranking. The loudest internal voice is rarely pointing at the best opportunity. Systematic scoring, even a simple weighted spreadsheet, outperforms intuition when the stakes are high.
Key Takeaways
The most capital-efficient path to growth starts with internal signals and existing customer data before moving to new markets or new products.
| Point | Details |
|---|---|
| Start with internal signals | Margin growth, inbound demand, and team strain reveal real opportunities before external research does. |
| Apply JTBD and Ansoff Matrix | These frameworks classify opportunities by customer need and strategic risk level. |
| Validate unit economics first | Model CAC, AOV, and retention before committing to any new market direction. |
| Use a scan and sift process | Broad scanning prevents premature narrowing; sifting applies weighted criteria to rank options. |
| Sequence by risk | Penetrate core segments first, then expand geographically, then enter new verticals. |
The mistake I keep seeing leaders make
Most leaders I work with arrive at growth planning with a shortlist already in mind. They have mentally committed to one or two directions before the analysis even starts. The scan phase becomes theater. The sift phase confirms what they already believed.
The research is clear: premature narrowing causes businesses to miss less obvious but genuinely valuable markets. The best opportunities I have seen were not the obvious ones. They were the ones that showed up in the data after someone was willing to look at the full picture first.
My honest advice: treat your existing customer base as your first market research asset. The behavioral data you already own tells you more about where to grow than any analyst report. Leaders who look inward first before chasing new markets consistently find faster, cheaper, and more defensible growth paths. Intuition has a role, but it should confirm what the data suggests, not replace it.
— Colin Bowdery
What Blue Prysm brings to your growth analysis
Running a proper scan and sift process requires real-time market data, behavioral signals, and competitor tracking. Most small and mid-sized businesses do not have a research team to pull that together. Blue Prysm does it for them.
Blue Prysm’s market analysis platform synthesizes market signals, customer behavior patterns, and competitive movement into clear intelligence briefings. The platform applies AI to accelerate the data gathering that normally takes weeks of manual work. Business leaders get ranked opportunity signals, not raw data dumps. Blue Prysm also includes a strategy library with over 95 frameworks, including JTBD templates and Ansoff Matrix tools, so you can move from analysis to decision without switching platforms.
FAQ
What is growth opportunity identification?
Growth opportunity identification is the process of finding specific, evidence-backed ways a business can expand revenue or market reach. It combines internal data analysis, customer research, and structured frameworks to surface and rank viable directions.
How does the Jobs-to-be-Done framework help spot growth areas?
JTBD reveals the underlying task a customer is trying to accomplish, not just the product they buy. This uncovers underserved needs that standard market research misses, pointing directly to high-potential innovation and expansion areas.
Why do unit economics matter in evaluating growth chances?
Unit economics determine whether a market opportunity is actually profitable at realistic scale. A large Total Addressable Market means nothing if customer acquisition cost exceeds revenue per customer over the relationship lifetime.
What is the scan and sift approach to growth prioritization?
Scan and sift is a two-phase process: first, gather every plausible growth direction without filtering; then apply weighted criteria like market size, competitive intensity, and strategic fit to rank and select the best options.
How does geographic expansion compare to entering new verticals?
Geographic expansion into segments that match your existing customer profile carries lower risk than new vertical entry. It uses validated product-market fit and existing customer data rather than requiring a full new validation cycle.