
TL;DR:
- Market trend analysis involves systematically assessing data to identify patterns that inform strategic decisions. It requires a clear scope, validated methodology, and tiered monitoring to prevent insights from becoming outdated or overlooked.
Market trend analysis is the process of systematically assessing market data to identify patterns that inform sound business decisions. Done well, it tells you where demand is heading before your competitors act on it. Done poorly, it produces a stack of reports nobody reads and decisions still driven by gut feeling. This guide gives business analysts and decision-makers a practical framework for conducting industry trend analysis in 2026, covering tools, step-by-step methodology, signal validation, and the cadence mistakes that quietly kill most analysis programs.
How to analyze market trends: prerequisites and tools
Before you collect a single data point, you need a defined scope. Analysts who skip this step end up monitoring everything and acting on nothing. Pick one market category, one geography, and one time horizon before you open any dashboard.
The core data sources for market trend analysis fall into four buckets: customer reviews and ratings, search volume trends, social media signals, and competitor activity. Each source answers a different question. Reviews reveal what buyers actually value. Search trends show where attention is moving. Social signals surface language shifts before they reach analyst reports. Competitor activity tells you what well-resourced teams are betting on.
| Data type | Best source | What it reveals |
|---|---|---|
| Consumer sentiment | Product reviews, forums | Unmet needs, satisfaction gaps |
| Search demand | Keyword tools, Google Trends | Category growth or decline |
| Competitive moves | Job postings, press releases | Strategic priorities |
| Regulatory signals | Government filings, trade publications | Structural market shifts |
The right tool depends on your team size and budget. Entry-level setups combine free search trend tools with manual review aggregation. Mid-market teams typically add statistical software for CAGR calculations and a dashboard for competitive monitoring. Enterprise platforms automate most of this and push alerts directly to strategy teams. Blue Prysm’s market research tools sit in the mid-market category, built specifically for analysts who need AI-driven synthesis without a full data science team behind them.
Pro Tip: Limit your initial scope to one product category and one competitor set. Research shows a focused 15-minute daily routine outperforms broad weekly sweeps because it keeps signal quality high and prevents data overload.
What does a step-by-step trend analysis process look like?
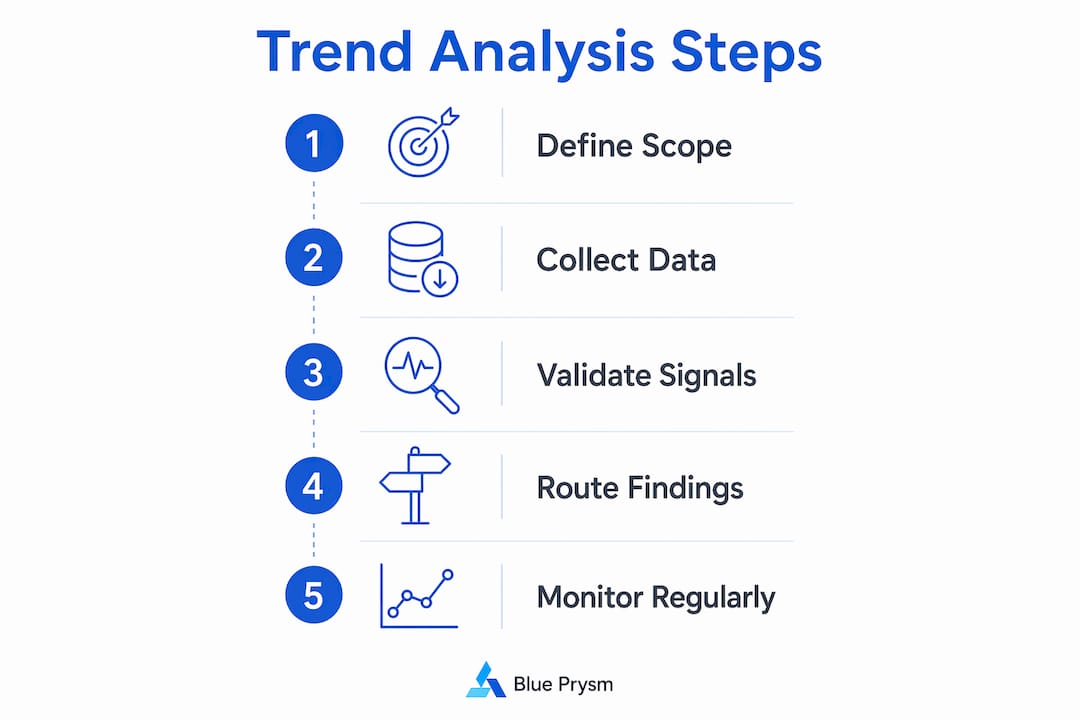
A repeatable process is what separates analysts who influence decisions from those who produce decks nobody acts on. The six-stage process below applies whether you are analyzing a consumer goods category or a B2B software segment.
- Set a measurable goal. Define what decision this analysis will inform. “Understand the market” is not a goal. “Determine whether Category X warrants a product investment in Q3” is.
- Collect data within a defined window. Aggregate competitor reviews from the last 90–180 days to establish a reliable baseline. Shorter windows miss cyclical patterns. Longer windows dilute recent signals.
- Cluster themes. Group raw data points into recurring themes using a method called theme clustering. You are looking for patterns, not individual data points. Three or more independent mentions of the same problem constitute a signal worth tracking.
- Compare against a baseline. Use consistent time horizons for reporting. Industry standards recommend a 3-year CAGR for recent momentum and a 10-year outlook for cyclical trends. Mixing these windows in the same report produces misleading conclusions.
- Validate with multiple signal types. A single data source is an observation. Two corroborating sources are a hypothesis. Three independent signals across different categories constitute a validated trend worth acting on.
- Route findings to a decision. Categorize each validated trend as ACT, WATCH, or PASS. ACT means the signal is strong enough to change a plan now. WATCH means you monitor it at the next review cycle. PASS means it does not meet your threshold and gets dropped.
The validation step is where most analysis breaks down. Analysts confirm what they already believe by pulling from one source. The fix is a tiered trigger model where three independent signals from different categories must align before a finding escalates to a strategic review.
Pro Tip: Build your ACT/WATCH/PASS routing into a shared document your whole team can see. When everyone uses the same threshold, you eliminate the “I thought we were watching that” conversations that waste meeting time.
How do you monitor industry-specific signals for trend validation?
Raw data collection is the easy part. Interpreting what the signals mean in context is where analysts earn their credibility. Two frameworks do most of the heavy lifting here.

Porter’s Five Forces remains the preferred framework for assessing industry structural attractiveness. The key is treating it as a living document, not a one-time exercise. Supplier power, buyer power, and the threat of substitutes all shift as markets evolve. An analysis you ran 18 months ago is likely wrong in at least two dimensions today.
PESTEL (Political, Economic, Social, Technological, Environmental, Legal) complements Porter’s by capturing macro-environmental shifts that structural analysis misses. Regulatory changes and technology adoption curves often show up in PESTEL before they appear in revenue data.
Beyond frameworks, effective analysts monitor weak signals across these categories:
- Patent filings: Companies patent what they plan to build, often 18–24 months before launch.
- Competitor hiring patterns: A sudden spike in machine learning engineer postings signals a product direction shift.
- Regulatory dockets: Proposed rules in adjacent industries often migrate to yours within two to three years.
- Customer language shifts: Customer language leads brand and analyst language by 3–9 months. Monitoring review sections and social forums gives you a head start on what the next analyst report will confirm.
The goal of signal triage is not to monitor everything. Effective monitoring filters high volumes of data into summaries that impact strategic decisions, not comprehensive catalogs of everything that happened.
What are the most common pitfalls in market trend analysis?
The most common failure in trend analysis is cadence mismatch. Monitoring too infrequently causes missed signals. Monitoring too frequently causes burnout and noise fatigue. A tiered cadence solves this: daily or weekly reviews for competitive moves and breaking news, monthly deep dives for trend analysis and framework updates.
Category scoping errors are the second most common problem. Analysts who define their market too broadly end up comparing signals that do not belong together. A consumer electronics analyst tracking “technology” instead of “wireless audio” will miss the shift from over-ear headphones to open-ear formats until it is already reflected in sales data.
Data aggregation window errors are subtler but equally damaging. Pulling 30 days of review data to assess a trend that moves on a 12-month cycle produces false confidence in either direction. Match your aggregation window to the natural rhythm of your category.
Analysis paralysis is the trap at the other end. Some teams collect so much data that no decision ever gets made. The ACT/WATCH/PASS routing system from the process section above is the direct fix. If a finding cannot be routed to one of those three categories, the analysis is not complete yet.
Pro Tip: Set a calendar reminder to audit your monitoring cadence every quarter. What worked when you had three competitors may be insufficient when you have ten.
Key Takeaways
Effective market trend analysis requires a defined scope, a validated methodology, and a tiered monitoring cadence to convert signals into decisions.
| Point | Details |
|---|---|
| Define scope first | Pick one category, one geography, and one time horizon before collecting data. |
| Use consistent time horizons | A 3-year CAGR measures momentum; a 10-year outlook captures cyclical patterns. |
| Apply the tiered trigger model | Three independent signals across different categories validate a trend for strategic review. |
| Monitor customer language early | Customer language shifts precede analyst reports by 3–9 months. |
| Match cadence to signal type | Use daily or weekly reviews for competitive moves and monthly reviews for deep trend analysis. |
Why most trend analysis programs quietly fail
I have reviewed a lot of market analysis work across small and mid-size businesses, and the pattern is almost always the same. The analysis itself is fine. The cadence is broken. Teams run a thorough trend report in January, feel good about it, and then make every major decision in October based on data that is nine months old.
The automation argument cuts both ways. AI tools can surface signals faster than any human team. But they cannot tell you which signals matter for your specific strategic position. That judgment still requires a person who understands the business context. The analysts who get this right use automation for data collection and human judgment for interpretation. They do not outsource the thinking.
Small and mid-size businesses actually have an advantage here that they rarely use. Large enterprises have to run trend analysis through committees. A team of three can monitor competitor activity and update their strategic view in a single afternoon. The constraint is not resources. It is discipline and process.
The one practice I keep coming back to is monitoring customer language in review sections and social forums before reading any analyst report. By the time a trend appears in a published report, the early movers have already acted. The signal was in the customer reviews six months earlier.
— Colin Bowdery
Blue Prysm’s market analysis platform for strategy teams
Business analysts who follow the methodology above still need a place to run it. Pulling data from five separate tools, reconciling formats, and building a shared ACT/WATCH/PASS tracker manually takes hours that most strategy teams do not have.
Blue Prysm’s market analysis platform brings real-time market briefings, competitor monitoring, and a structured strategy library into one place. It is built for analysts who need to move from signal to decision without a large research team behind them. The platform applies the same tiered monitoring logic described in this guide, so your cadence stays consistent without manual upkeep. If you want to see what a finished intelligence briefing looks like before committing, Blue Prysm offers a sample intelligence briefing you can review directly.
FAQ
What is industry trend analysis?
Industry trend analysis is the systematic process of collecting and interpreting market data to identify patterns that affect a specific sector. It uses frameworks like Porter’s Five Forces and PESTEL alongside quantitative measures like CAGR to assess where a market is heading.
How often should you monitor market trends?
A tiered cadence works best: daily or weekly for competitive moves and breaking signals, monthly for deep trend analysis and framework updates. Monitoring too frequently causes burnout; too infrequently causes missed signals.
What data sources are most reliable for trend analysis?
Customer reviews, search volume data, patent filings, and regulatory dockets each reveal different dimensions of a trend. Using three independent sources across different categories is the standard threshold for validating a signal before acting on it.
How do you avoid analysis paralysis in trend research?
Route every finding to one of three categories: ACT, WATCH, or PASS. If a finding cannot be assigned to one of those categories, the analysis is incomplete. This forces a decision at every stage rather than letting findings accumulate without resolution.
What is the best time horizon for market trend forecasting?
Industry standards recommend a 3-year CAGR to measure recent momentum and a 10-year outlook to capture cyclical trends. Mixing these windows in the same report produces misleading conclusions.