
TL;DR:
- Business analytics uses data and models to improve decision-making across organizations. Smaller firms often see higher gains from lean, integrated analytics systems compared to large enterprises. Successful implementation depends on embedding analytics into workflows and building organizational capabilities.
Business analytics is defined as the systematic use of data, statistical methods, and modeling techniques to improve organizational decision-making and performance. The field breaks into four functional levels: descriptive, diagnostic, predictive, and prescriptive analytics, each building on the last in complexity and value. Research published in the Journal of Business Research confirms that improved decision quality is the primary mechanism through which analytics capabilities translate into better firm performance. For business professionals, that finding is the whole ballgame. Analytics is not a technology project. It is a decision-making discipline.
What are the core types of business analytics?
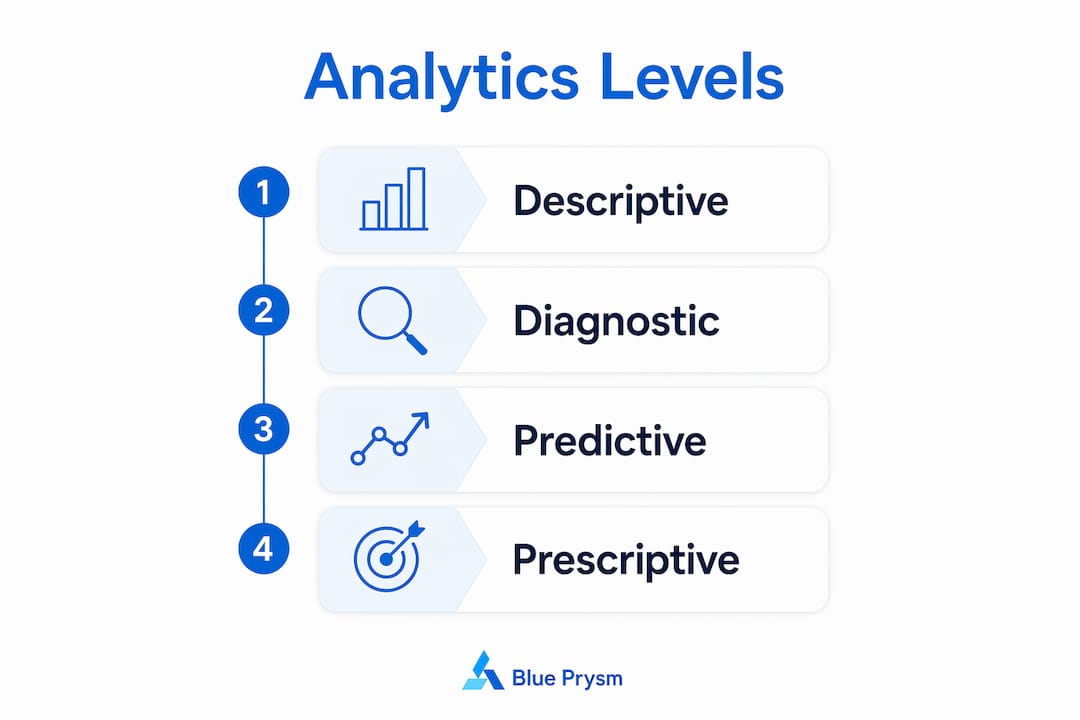
Business analytics organizes into four distinct levels, and each one answers a different business question. Understanding the difference keeps you from buying a prescriptive analytics platform when a simple dashboard would do.

| Analytics type | Question answered | Business example |
|---|---|---|
| Descriptive | What happened? | Monthly sales report by region |
| Diagnostic | Why did it happen? | Root cause analysis of a revenue drop |
| Predictive | What will happen? | Churn probability scoring for customers |
| Prescriptive | What should we do? | Automated pricing recommendations |
Descriptive analytics is the starting point. It summarizes historical data into reports, dashboards, and scorecards. Most organizations already do this, even if they do not call it analytics. Diagnostic analytics goes one layer deeper, using techniques like drill-down analysis and correlation to explain why a result occurred. Predictive analytics applies statistical models and machine learning to forecast future outcomes. Prescriptive analytics, the most advanced level, recommends specific actions and sometimes executes them automatically.
The four levels build on each other. You cannot run reliable predictive models without clean historical data. You cannot prescribe actions without understanding what drives outcomes. Most mid-size businesses operate primarily at the descriptive and diagnostic levels, and that is a perfectly legitimate starting point.
Pro Tip: Match your analytics investment to your data maturity. If your team still debates which sales number is correct, fix your data quality before buying a predictive modeling tool.
How does business analytics differ from business intelligence and data science?
These three terms get used interchangeably, and that confusion costs organizations real money. They are not the same thing.
- Business intelligence (BI) focuses on descriptive reporting. It answers “what happened?” by measuring past performance through dashboards, KPIs, and standardized reports. BI is backward-looking by design.
- Business analytics extends beyond BI. As Wikipedia’s business analytics entry notes, BI answers “what happened?” while analytics answers “why it happens” and “what to do next.” The forward-looking orientation is the key distinction.
- Data science covers a much broader scientific territory. It includes research applications, natural language processing, computer vision, and academic modeling that may have no direct business application. Business analytics targets consumer behavior, market trends, and internal efficiencies specifically.
The practical implication is this: if your team is building dashboards to track last quarter’s revenue, that is BI. If your team is modeling which customers will churn next month and recommending retention offers, that is business analytics. Misreading one for the other leads to missed opportunities. Organizations that treat their BI reports as the ceiling of their analytics capability leave the most valuable insights on the table.
Decision-makers are shifting from gut-based choices to a culture that demands quantitative clarity for high-impact decisions. That shift is not a trend. It is a structural change in how competitive advantage gets built.
What organizational benefits does business analytics deliver?
The benefits of business analytics are concrete, not theoretical. Research using PLS-SEM and fsQCA methodology shows that complementary bundles of analytics capabilities drive better decision quality, which then drives firm performance. The word “complementary” matters here. No single tool or technique delivers results alone.
“Smaller organizations often achieve higher relative performance improvements from lean, integrated business analytics systems compared to larger firms. Success depends on complementary bundles of technical, human, and contextual capabilities aligned with business context.”
Journal of Business Research, 2026
Three benefit categories stand out across industries. First, operational efficiency: analytics identifies waste, bottlenecks, and underperforming processes faster than manual review. Second, risk mitigation: predictive analytics equips firms to forecast potential losses, detect fraud, and spot supply chain vulnerabilities before they become crises. Third, market opportunity identification: analytics surfaces patterns in customer behavior and competitive positioning that are invisible to the naked eye.
The firm size finding deserves attention. Smaller businesses often get more value per dollar from lean, integrated analytics than large enterprises do from complex infrastructures. This is not because the tools are simpler. It is because smaller organizations can align analytics outputs directly to decisions without the organizational friction that slows large firms down. For SMEs, data-driven strategy wins are often faster and more visible than in enterprise settings.
The cross-functional reach of analytics also matters. Analytics transforms raw data into intelligence that supports finance, marketing, operations, and supply chain decisions simultaneously. That cross-functional reach is what separates analytics from a departmental reporting tool.
How can you implement business analytics effectively?
Implementation is where most analytics initiatives fail. The technology is rarely the problem. The integration is.
- Audit your current data. Before selecting any tool, map what data you collect, where it lives, and how reliable it is. Bad data produces confident wrong answers.
- Define the decisions you want to improve. Analytics without a decision target is just reporting. Identify two or three high-stakes decisions where better information would change the outcome.
- Match the analytics level to your maturity. Start with descriptive and diagnostic analytics if your team lacks data fluency. Build toward predictive and prescriptive as capability grows.
- Integrate analytics into existing workflows. Insights that live in a separate dashboard no one checks do not change decisions. Embed outputs into the tools your team already uses daily.
- Build human capability alongside technical systems. Analytics outcomes depend on combined technical systems, human expertise, and organizational context. Isolated tools rarely suffice.
The role of data-driven decisions in strategy is not about having the most sophisticated platform. It is about making better calls more consistently. A mid-size retailer using diagnostic analytics to understand why a product line underperforms will outperform a competitor running expensive predictive models that nobody acts on.
Pro Tip: Avoid treating analytics as an IT project. Assign a business owner to every analytics initiative. If no one in the business is accountable for acting on the output, the investment will not pay off.
Key Takeaways
Business analytics delivers its highest value when decision quality improves across functions, not just within a single department or tool.
| Point | Details |
|---|---|
| Four analytics levels | Descriptive, diagnostic, predictive, and prescriptive analytics each answer a different business question. |
| BA vs. BI distinction | Business intelligence reports the past; business analytics explains it and recommends future action. |
| Decision quality drives performance | Research confirms improved decision quality is the primary path from analytics capability to firm performance. |
| SMEs benefit disproportionately | Smaller firms gain higher relative returns from lean, integrated analytics than large enterprises do. |
| Integration beats sophistication | Analytics tools only create value when embedded in workflows and paired with human judgment and organizational context. |
Why most analytics programs underdeliver (and how to fix that)
I have watched organizations spend six figures on analytics platforms and walk away with better-looking dashboards and the same decisions they were making before. The problem is almost never the software. It is the assumption that data automatically changes behavior.
The shift from gut-based to data-driven decision culture is real, but it is slower and harder than vendors admit. Most executives I have worked with trust their instincts more than a model they do not fully understand. That is not irrational. It is human. The fix is not to replace intuition with algorithms. It is to build enough analytical literacy in leadership that the outputs of a predictive model feel as credible as a trusted advisor’s opinion.
The other trap I see constantly is the “analytics silo.” A team builds a brilliant churn model in isolation, shares it in a quarterly review, and nothing changes. Analytics success is maximized when capabilities integrate across functions, not when they sit in a data team’s folder. The organizations getting real competitive advantage from analytics are the ones where the marketing lead, the ops director, and the finance team are all pulling from the same intelligence layer and acting on it weekly, not quarterly.
Start smaller than you think you need to. One well-used diagnostic report beats ten unused predictive models every time.
— Colin Bowdery
How Blue Prysm supports your analytics strategy
Business analytics only creates value when the intelligence reaches the people making decisions, at the right time, in a format they can act on.
Blue Prysm’s market analysis platform delivers real-time market briefings, competitor monitoring, and structured strategy frameworks built specifically for SMEs and executive teams. You get the kind of intelligence that used to require a full consulting engagement, without the six-figure price tag. For teams ready to move from descriptive reporting to genuine competitive intelligence, Blue Prysm’s market research tools provide AI-driven insights that feed directly into strategic planning workflows. The result is faster decisions, grounded in data, without the overhead.
FAQ
What is the business analytics definition?
Business analytics is the use of data, statistical methods, and modeling to analyze business performance and improve decision-making. It spans descriptive, diagnostic, predictive, and prescriptive techniques.
How does business analytics differ from business intelligence?
Business intelligence reports on past performance, while business analytics extends to predicting future outcomes and recommending specific actions. BI answers “what happened?” and analytics answers “why” and “what next.”
What are the main benefits of business analytics?
The core benefits include better decision quality, operational efficiency, risk mitigation through predictive forecasting, and faster identification of market opportunities across finance, marketing, and operations.
Do small businesses benefit from business analytics?
Research confirms that smaller organizations often achieve higher relative performance gains from lean, integrated analytics systems than larger firms do. The key is matching tools to business maturity and decision workflows.
What tools are used in business analytics?
Business analytics tools range from basic reporting platforms for descriptive analytics to statistical modeling software and AI-driven platforms for predictive and prescriptive work. The right tool depends on your data maturity and the decisions you need to improve.