
Portfolio prioritization is the discipline of ranking competing projects against shared criteria and then filtering that ranking through what your teams can actually deliver. Done well, it produces one thing: a funded set of projects that matches your capacity, not just your ambition. The mechanism that gets you there is simple in concept: a weighted scoring model paired with a capacity overlay, sometimes called starts control.
TL;DR:
- Prioritization should incorporate capacity and start control to ensure funded projects are deliverable within available resources.
- Combining scoring models, categorical sorting, and visual methods enhances accuracy and speed in ranking competing projects.
- A disciplined process includes calibration, evidence-based scoring, scenario stress-testing, and transparent decision-making to prevent common execution failures.
- Using AI-enabled platforms simplifies evidence management, scenario modeling, and tracking, leading to more reliable and faster portfolio decisions.
What Portfolio Prioritization Actually Means (and Why Most Teams Get It Wrong)
Portfolio prioritization is not the same thing as backlog grooming, and it’s not the same as picking your next project. Backlog prioritization ranks items within one team’s queue. Single-project selection asks “should we do this?” in isolation. Portfolio prioritization asks a harder question: across every initiative competing for the same people, budget, and quarter, which combination delivers the most strategic value without breaking the organization that has to build it.
Skip this discipline and you get familiar symptoms. Resource overload, where five “top priority” projects share the same three engineers. Low ROI, because loud stakeholders win funding instead of high-value ideas. Politics-driven roadmaps, where the project that survives is the one championed by the most senior voice in the room, not the one with the best numbers.
The payoff for fixing this runs deeper than a tidier spreadsheet:
- Clearer trade-offs, because everyone can see why Project A beat Project B on the same scale
- Better ROI, since funding follows evidence instead of the last person who pitched in the hallway
- Higher throughput, because multitasking measurably hurts delivery speed when too many things start at once
- Defensible funding decisions that survive a board question or a budget cut without a scramble
Common Prioritization Frameworks and When Each One Earns Its Place
There is no single best framework. There are three families, and each solves a different part of the problem.
Scoring models rank projects on a numeric scale built from weighted criteria. Weighted scoring is the workhorse: pick 4 to 6 criteria, assign weights, score every candidate, sum the results. RICE (Reach, Impact, Confidence, Effort) works well for product teams comparing features at similar scale. WSJF (Weighted Shortest Job First), borrowed from the Scaled Agile Framework, divides a cost-of-delay score by job size, which makes it strong for teams that need to sequence, not just rank.
Categorical methods sort rather than score. MoSCoW (Must have, Should have, Could have, Won’t have) is fast and useful early, when you need to separate mandatory compliance work from everything else before you spend time scoring anything.
Visual methods trade precision for speed. The impact/effort 2×2 grid plots every candidate on two axes and instantly shows you the quick wins and the traps. It won’t rank twelve similar high-impact projects against each other, but it will clear obvious losers in minutes.
A more rigorous cousin of weighted scoring is the Analytic Hierarchy Process, or AHP, which scales to dozens of criteria and includes a built-in consistency check that flags contradictory judgments during group weighting sessions. It takes longer to run than a simple weighted model, so save it for high-stakes, high-conflict portfolios where the extra rigor pays for itself.
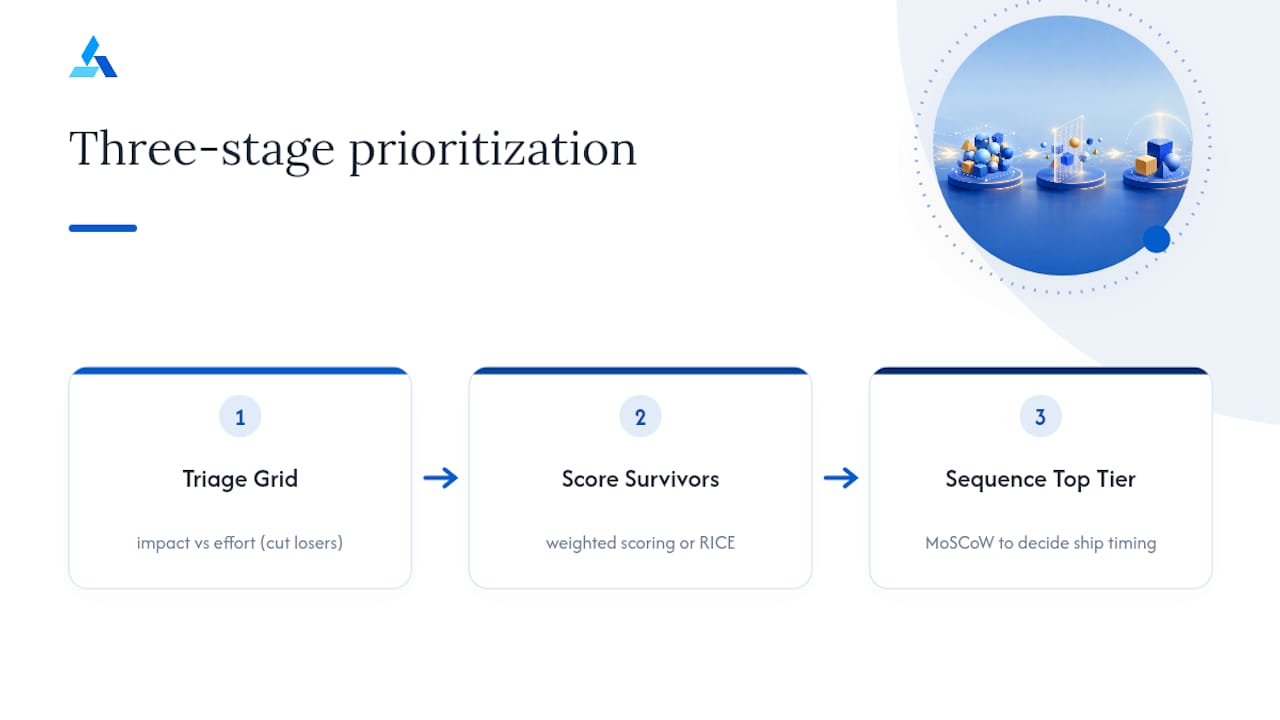
The smartest teams combine all three. Triage the intake list with an impact/effort grid to cut the obvious no’s. Score the survivors with weighted scoring or RICE. Then apply MoSCoW inside your top tier to decide what actually ships this quarter versus next.
A Practical 7-Step Portfolio Prioritization Process You Can Run
Here is the workflow, start to finish, for turning an intake pile into a funded portfolio.
-
Pre-sort mandatory versus discretionary. Pull out compliance, security, and contractual work first. These don’t compete for rank; they compete for a place on the calendar. Clean your intake so every remaining candidate has a name, sponsor, and rough cost estimate.
-
Set the strategic frame and planning horizon. Decide whether you’re prioritizing for a quarter, a fiscal year, or a rolling 18 months. Anchor everything to your current strategic goals, since PMI’s research on benefits realization ties project success directly to strategic alignment.
-
Define 4 to 6 criteria and anchored scales, then get leadership to ratify the weights. This step fails silently more than any other; more on that below.
-
Pick a scoring model and score every candidate with evidence, not gut feeling. Attach a source or data point to each score.
-
Rank the list and overlay capacity. This is where most prioritization exercises quietly fall apart, and it’s covered in detail in the next section.
-
Validate sequencing and stress-test with scenarios. Run a base case, an accelerated case, and a constrained case before you commit.
-
Take the governance decision, publish the rationale, and set a re-score cadence. A ranking that nobody can see is a ranking nobody trusts.
Pro Tip: Run steps 1 through 4 in a single working session with your scoring panel in the room. Splitting scoring across async surveys is where calibration drift creeps in, and you won’t notice until two raters give the same project scores three points apart.
Designing a Scoring Model: Criteria, Weights, and Keeping Raters Honest
Fewer criteria beat more criteria. A compact set of 4 to 6 preserves clarity, while a longer list adds false precision and actually reduces how well scores discriminate between projects. Celoxis’s research on portfolio prioritization points to common weight ranges worth starting from:
- Strategic alignment: 25% to 35%
- Financial return: 20% to 30%
- Risk: 15% to 25%
- Effort or cost: 15% to 25%
The consistency problem: small differences in how raters interpret a scale produce large swings in final rank. Research on group decision processes identifies scoring consistency as a primary failure point in portfolio exercises, and the fix is unglamorous: anchored scales with concrete evidence examples at each point (a 0 to 5 scale where “3” means “documented customer request from at least two accounts,” not a vague label like “medium interest”).
Run a calibration session before scores go live. Have your panel score two or three sample projects together, compare results out loud, and argue through the gaps. That single hour catches more bias than any amount of after-the-fact auditing. And pick one job for effort: it belongs either inside the score as a weighted criterion, or outside as the capacity driver that determines who gets built. Let it play both roles and you’ll double-penalize expensive projects without meaning to.
From Ranking to a Feasible Portfolio: Capacity and Starts Control
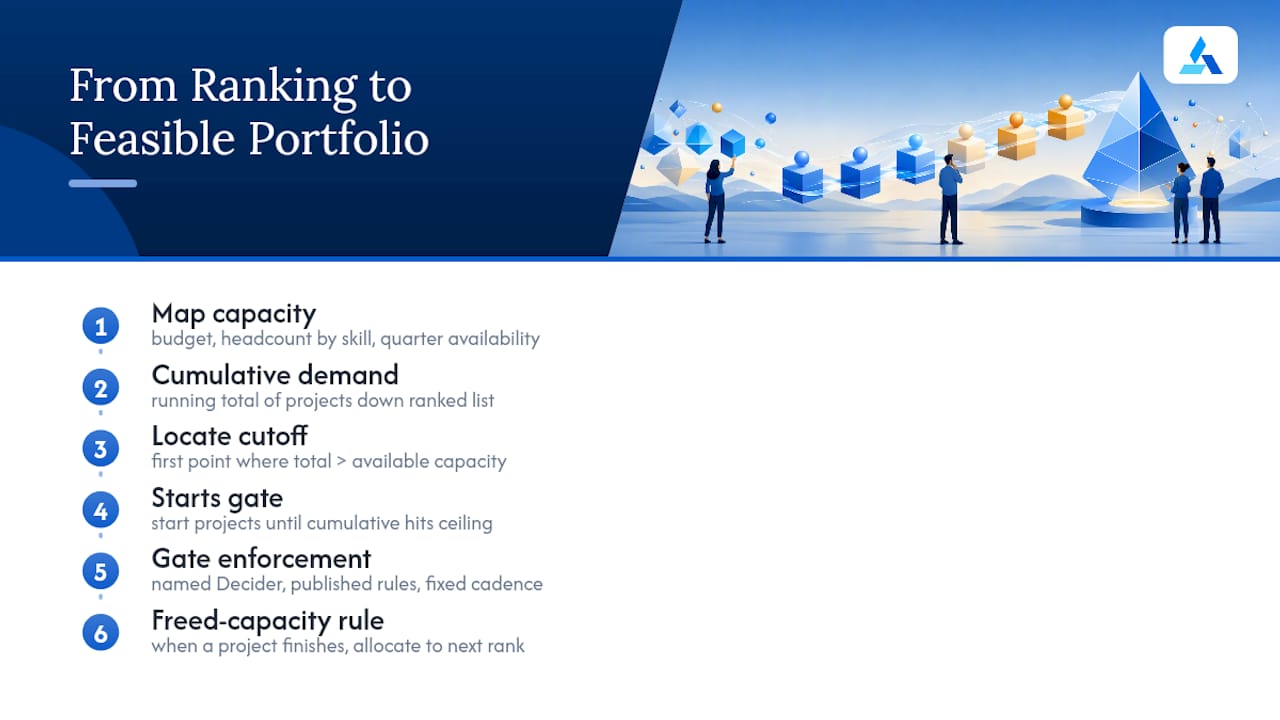
A ranked list without a capacity overlay is a wish list. Portfolio Hub’s research on prioritization matrices makes this point directly: the ranking tells you order, not what’s actually buildable. Modeling capacity means mapping your budget envelope, your headcount by skill category, and quarter-by-quarter availability against the projects sitting at the top of your list.
The mechanism is a cumulative-demand column next to your rank column. Add each project’s resource requirement running down the list until the running total crosses your available capacity. That crossing point is your cutoff line, and everything below it doesn’t get funded this cycle, no matter how high it scored.
Lateralworks’s research on starts control shows that starting fewer projects at once, gated by a rule that loads work in priority order until cumulative demand hits the ceiling, improves both delivery rate and on-time completion. Making that gate work in practice takes a named Decider with authority to say no, published gate rules everyone can see, a fixed review cadence, and a rule for what happens to freed capacity when a project finishes early: it flows automatically to the next item in rank order, not to whoever asks loudest. Teams juggling headcount by skill category often find resource allocation models built for smaller organizations a useful reference point when building this capacity layer.
Governance, Decision Rights, and Handling Overrides Without Wrecking the Model
Assign three roles before you run your first cycle. A portfolio Decider who owns the final call. A scoring panel that scores candidates and defends the ratings. Finance and strategy representatives who validate that scores tie back to budget reality and enterprise goals.
Set a cadence and keep it. Quarterly ratification of the ranked list and weights. Monthly health checks on the projects already funded. Weekly execution refreshes for teams actually building.
Overrides will happen; a client emergency or a regulatory deadline doesn’t wait for the next quarterly cycle. The fix isn’t banning overrides, it’s disciplining them:
- Every override needs a documented reason tied to the same criteria used elsewhere.
- Overrides stay traceable in the same log as regular decisions, not a side channel.
- Set sunset criteria up front, so a temporary exception doesn’t quietly become permanent.
Planview’s research on ranking models found that high-performing portfolios share four traits: scoring consistency, evidence-based evaluation, ranking transparency, and clear decision-making. Publishing your rationale, including every override, is what keeps a scoring model trusted instead of quietly ignored.
Sequencing, Dependencies, and Testing Your Portfolio Against Reality
Ranking order and build order aren’t always the same thing. A lower-ranked project that unlocks three higher-ranked ones needs to move earlier in the sequence, even if its raw score doesn’t justify it alone.
- Map blocking dependencies before you finalize the funded list, and weight dependency risk higher for projects with multiple downstream consumers
- Sequence enabling work ahead of the projects that depend on it, not in parallel
- Test three scenarios: base case (current capacity), accelerated (added headcount or budget), and constrained (a hiring freeze or lost budget)
- Watch for triggers that force an immediate re-prioritization outside the normal cadence: an acquisition, losing a major customer, or a regulatory change that reclassifies a “nice to have” as mandatory
Your Next 90 Days: A Prioritization Cycle Checklist
- Weeks 1 to 2: Collect intake data, invite your scoring panel and Decider, and prepare scoring templates and anchored scales.
- Weeks 3 to 4: Score every candidate with evidence, ratify weights with leadership, and run a calibration session.
- Weeks 5 to 6: Rank, overlay capacity, draw the cutoff line, and stress-test with scenarios.
- Week 7 onward: Publish the ranked list, the decision log, and a fixed re-score schedule.
How an AI-Enabled Platform Handles the Heavy Lifting
Running this process by hand in a spreadsheet works, especially the first time. It gets harder to sustain once you’re re-scoring quarterly with a rotating panel and a growing decision log nobody wants to comb through manually.
An AI-enabled strategy platform earns its place by making the traceability part effortless instead of a chore someone abandons after two cycles:
- Centralized scoring templates keep criteria, weights, and evidence in one place instead of scattered across five spreadsheets
- Automated market and competitor tracking feeds real evidence into scores, so a rater isn’t guessing at “market opportunity” from memory
- Capacity overlays and scenario modeling live inside the same workspace, so a base, accelerated, or constrained case takes minutes, not a new spreadsheet
- Decision packets and roadmaps generate straight from the scored, ranked, capacity-checked list, ready for the governance review
Teams building out their criteria set often start from an existing strategy framework library rather than inventing weighting logic from scratch, and pair that with a market opportunity assessment workflow to keep the evidence behind each score current.
Where Prioritization Cycles Actually Break Down
Most portfolio prioritization efforts don’t fail on framework choice. They fail on discipline. Teams skip the calibration session because it feels like overhead, then wonder why two raters scored the same project four points apart. They score everything and forget the capacity overlay, so the “ranked list” is really just a wish list with a number attached, exactly the trap Portfolio Hub’s research warns against.
The fix is smaller than people expect: start with one criteria set, name one Decider, cap how many projects can be open at once, and write down the evidence behind every score before you defend it in a room. Iterate the cadence after your first cycle. It won’t be perfect the first quarter, and it doesn’t need to be.
— Colin Bowdery
See Your Portfolio’s Real Capacity, Not Just Its Wish List
If the scoring, calibration, and capacity math above sounds like a lot to run by hand every quarter, that’s because it is. The platform builds the evidence-capture and scoring layer directly into the platform, so competitor tracking and market signals feed your scores automatically instead of living in someone’s memory from a meeting three weeks ago.
The platform’s market research tools pull the evidence your scoring panel needs before anyone opens a spreadsheet, and the market analysis platform lets you run base, accelerated, and constrained capacity scenarios without rebuilding your model from scratch each quarter. None of this replaces a spreadsheet if a spreadsheet is genuinely working for your team; plenty of well-run portfolios still live in Excel. But if your last prioritization cycle took three weeks and still produced a list nobody trusted, see how it works and decide for yourself whether it’s worth the switch.
Sources
- Portfolio prioritization & starts control (Lateralworks)
- Project prioritization matrix: criteria, scoring, example (Portfolio Hub)
- Project Portfolio Prioritization Frameworks and Tools for PMOs (Celoxis)
FAQ
What are the 5 levels of priority?
Most portfolio frameworks use tiers like critical, high, medium, low, and deferred, though the exact labels vary by organization. What matters more than the labels is that each tier ties back to a documented score, not a subjective label assigned in a meeting.
What are the 7 steps of the portfolio prioritization process?
Pre-sort mandatory versus discretionary work, set the strategic frame, define criteria and weights, score every candidate with evidence, rank and overlay capacity, validate sequencing with scenarios, and make the governance decision with published rationale.
What is the difference between PPM and PMO?
PPM (project portfolio management) is the discipline and set of processes for selecting, prioritizing, and overseeing a group of projects against strategic goals. A PMO (project management office) is the organizational team or function that often runs those PPM processes, along with governance, reporting, and methodology support.
What are the four methods of prioritization?
The most commonly cited methods are weighted scoring, MoSCoW, the impact/effort grid, and the Analytic Hierarchy Process, each suited to a different level of rigor and group conflict. Frameworks like RICE and WSJF are variations on weighted scoring, built for specific contexts like product features or agile sequencing.