
TL;DR:
- Analytics involves discovering patterns in data to support informed decisions. Mastering all four types of analytics enables organizations to outperform competitors who only report results.
Analytics is defined as the systematic process of discovering, interpreting, and communicating meaningful patterns in data to support informed decisions. It draws on math, statistics, and machine learning to turn raw numbers into clarity. The four-stage maturity model — descriptive, diagnostic, predictive, and prescriptive — is the industry standard for classifying how organizations use data. For business professionals, understanding analytics is not a technical exercise. It is a competitive necessity.
What is analytics, and what are its four main types?
Experts classify analytics into four types that reflect increasing complexity and business value. Each type answers a different question, and knowing which one to apply is the difference between reporting and real strategy.
| Type | Question answered | Business value |
|---|---|---|
| Descriptive | What happened? | Summarizes past performance through dashboards and reports |
| Diagnostic | Why did it happen? | Identifies root causes behind trends or anomalies |
| Predictive | What will happen? | Forecasts outcomes using historical data and algorithms |
| Prescriptive | What should we do? | Recommends specific actions to reach a desired outcome |
Most organizations start with descriptive analytics because it is the easiest to implement. A monthly sales report is descriptive. A churn model that flags at-risk customers before they leave is predictive. A system that tells your sales team exactly which customers to call first, and with what offer, is prescriptive.

The trap most executives fall into is treating descriptive reporting as the finish line. It is not. Descriptive analytics tells you the score. Prescriptive analytics tells you how to win the next game.
Pro Tip: Start with the business question, not the data type. Ask “What decision does this analysis need to support?” and then choose the analytics type that answers it. Skipping this step is the single most common reason analytics projects fail to produce results.
How does the analytics process work in practice?
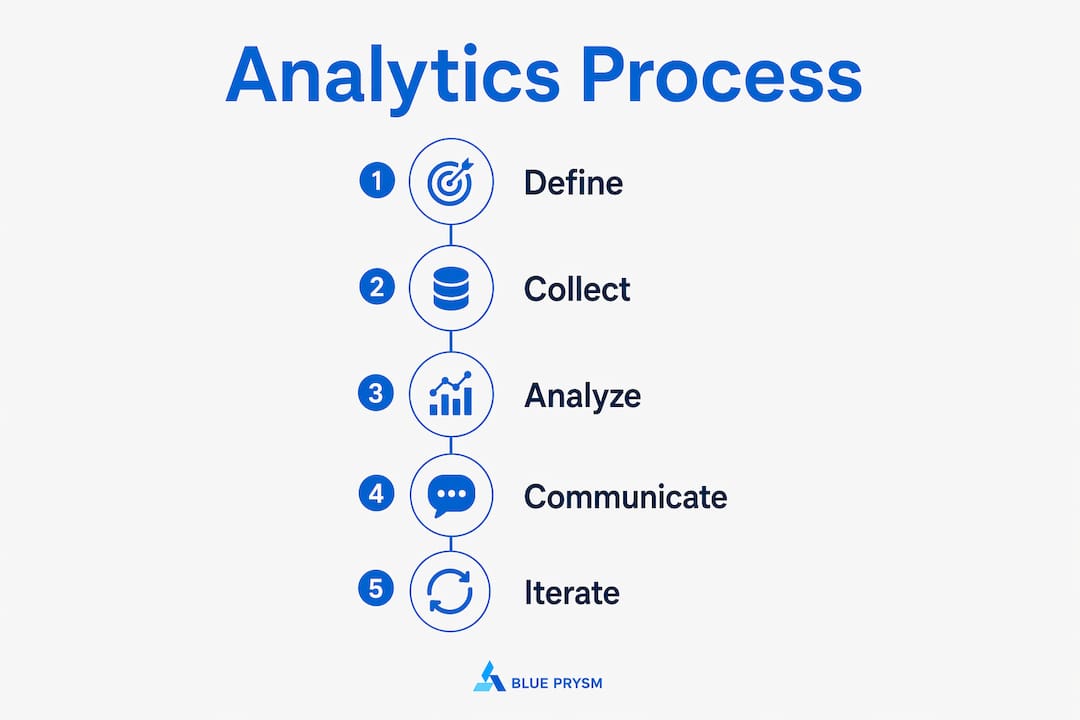
The analytics process is iterative, not linear. Think of it less like a conveyor belt and more like a feedback loop. Each cycle of analysis generates new questions that send you back to an earlier stage.
The six core stages are:
- Ask — Define the business question you need to answer. Be specific. “How do we grow revenue?” is not a question. “Which customer segment has the highest 90-day retention rate?” is.
- Prepare — Collect the raw data relevant to that question from internal systems, market sources, or third-party feeds.
- Process — Clean and structure the data. Remove duplicates, fill gaps, and standardize formats. This stage typically consumes the most time.
- Analyze — Apply statistical methods, algorithms, or visualization tools to surface patterns and relationships.
- Share — Translate findings into a narrative that non-technical stakeholders can act on. This is where business intuition and storytelling matter as much as math.
- Act — Implement decisions based on the analysis, then measure outcomes to feed the next cycle.
Analytics is non-linear by design. You will often reach the “analyze” stage and realize the data you collected does not answer the original question. That is not failure. That is the process working correctly.
Pro Tip: Define the business problem before you touch any data. Teams that start with strategic questions rather than available datasets consistently produce more useful insights.
What distinguishes analytics from data analysis and related fields?
These terms get used interchangeably, and that causes real confusion in organizations. The distinctions matter because they affect how you staff teams, buy tools, and set expectations.
Data analysis vs. analytics
Data analysis is a focused examination of a specific dataset to answer a specific question. It is a single task. Analytics is the broader, ongoing function that integrates data analysis into decision systems, predictive modeling, and organizational workflows. Modern analytics integrates real-time modeling and connects directly to business strategy. Data analysis is an input to that process.
Analytics vs. business intelligence
Business intelligence (BI) is primarily descriptive. It tells you what happened through reports, dashboards, and historical summaries. Analytics goes further. Analytics goes beyond BI by incorporating machine learning, predictive modeling, and prescriptive recommendations. If your BI platform is producing beautiful dashboards that nobody acts on, you are experiencing the gap between BI and analytics firsthand. The six-figure BI investment that still ends in Excel exports is a pattern that plays out in organizations of every size.
Analytics vs. data science
Data science is a technical discipline focused on building models and algorithms. Analytics is the organizational function that applies those models to business decisions. Data scientists build the engine. Analytics professionals drive the car. Both roles require multidisciplinary skills, including math, programming, and business intuition, but they serve different purposes. The best analytics teams also include people who can translate technical findings into clear narratives that executives and board members understand.
How is analytics applied strategically in modern business environments?
Analytics creates value when it connects directly to decisions, not when it sits in a report that nobody reads. Speed from insight to action is the real competitive advantage. Organizations that close that gap faster consistently outperform those that treat analytics as a quarterly reporting exercise.
Key strategic applications include:
- Competitive intelligence — Monitoring market shifts, pricing changes, and competitor moves in real time to adjust positioning before the market moves against you
- Customer behavior modeling — Predicting which segments will grow, churn, or respond to specific offers
- Operational efficiency — Identifying workflow bottlenecks through process data before they become expensive problems
- Market sizing and entry — Using data to validate Total Addressable Market assumptions before committing capital
| Application | Analytics type used | Business outcome |
|---|---|---|
| Sales forecasting | Predictive | Accurate pipeline planning and resource allocation |
| Customer churn reduction | Predictive + Prescriptive | Higher retention and lower acquisition costs |
| Competitive monitoring | Descriptive + Diagnostic | Faster strategic responses to market changes |
| Operational bottleneck analysis | Diagnostic | Reduced waste and improved throughput |
Embedding analytics into your data-driven decision-making process requires more than buying a platform. It requires defining which decisions need data support, assigning ownership of those decisions, and building a feedback loop that measures whether the analysis actually improved outcomes. Real-time data views are not a luxury for enterprise teams. They are the baseline for any organization that wants to compete on information rather than gut feeling.
Key takeaways
Analytics is the process of turning data into decisions, and the organizations that master all four types — descriptive, diagnostic, predictive, and prescriptive — consistently outperform those that stop at reporting.
| Point | Details |
|---|---|
| Four types, four purposes | Descriptive, diagnostic, predictive, and prescriptive analytics each answer a different business question. |
| Start with the question | Defining the business problem before collecting data is the most critical step in any analytics workflow. |
| Analytics is broader than BI | Business intelligence reports what happened; analytics drives forward-looking decisions and actions. |
| Speed creates advantage | Closing the gap between insight and action faster than competitors is the real source of analytics value. |
| Iteration is the method | The analytics process loops back on itself; treat each cycle as a learning opportunity, not a failure. |
Analytics is not a tool problem. It is a thinking problem.
I have worked with dozens of business leaders who believed their analytics challenges were about software. They were not. The organizations that get the most from their data are not the ones with the biggest platforms or the largest data science teams. They are the ones that ask sharper questions.
The most common mistake I see is treating analytics as a reporting function rather than a decision function. Teams spend months building dashboards that confirm what leadership already suspects, then wonder why nothing changes. The fix is not a better dashboard. It is a clearer question upstream.
Analytics also requires cross-functional collaboration that most organizations underestimate. The finance team holds unit economics data. The sales team holds customer behavior signals. The operations team holds process data. None of those datasets tells the full story in isolation. The real insight lives at the intersection, and getting there requires people who can bridge technical findings with business narratives that actually move decision-makers.
My honest recommendation: run your next analytics initiative through an agile, iterative cycle. Set a two-week sprint. Define one decision. Pull the minimum data needed. Share findings with stakeholders in plain language. Measure the outcome. Then repeat. That discipline, applied consistently, builds more analytical capability than any tool purchase.
— Colin Bowdery
Blue Prysm puts analytics to work for your strategy
Blue Prysm was built for business leaders who know that gut feeling is not a strategy. The platform delivers real-time market briefings, automated competitive intelligence, and AI-driven analysis that surfaces the insights your team needs before decisions become urgent.
The market analysis platform connects descriptive and predictive analytics directly to your planning workflows, so insights do not sit in a report. They drive action. For executives who want to move from data collection to strategic clarity without a six-figure consulting engagement, Blue Prysm is the direct path. See how it works and what it surfaces for businesses like yours.
FAQ
What is analytics in simple terms?
Analytics is the process of examining data to find patterns and use them to make better decisions. It combines math, statistics, and business judgment to turn raw information into clear direction.
What are the four types of analytics?
The four types are descriptive, diagnostic, predictive, and prescriptive. Each answers a progressively more complex business question, from “what happened” to “what should we do next.”
How is analytics different from business intelligence?
Business intelligence focuses on historical reporting and dashboards. Analytics goes further by incorporating predictive modeling and prescriptive recommendations that drive forward-looking decisions.
Why does the analytics process loop back on itself?
The process is iterative because each round of analysis often reveals gaps in the original question or data. Revisiting earlier stages is a sign of rigor, not inefficiency.
What is the most important step in the analytics process?
Defining the right business question is the most critical step. Teams that start with strategic questions rather than available data consistently produce more useful and actionable results.