
TL;DR:
- A dataset is a structured collection of related data points used to identify patterns, test hypotheses, and inform decisions. Analysts often choose available data that does not fit their specific goal, leading to costly errors. Picking the right dataset type and structure is essential for accurate analysis and effective decision-making.
A data set is a structured collection of related data points organized so analysts can extract patterns, test hypotheses, and inform decisions. The term “dataset” is the recognized industry standard, though “data set” appears equally in business contexts. Every meaningful analysis starts with one. The problem is that most analysts grab whatever data is available rather than selecting a sample that actually fits their analytical goal. That gap between “data we have” and “data we need” is where bad decisions get made.
A well-chosen data set example does more than fill a spreadsheet. It defines the questions you can ask, the models you can run, and the confidence you can place in your conclusions. Analysts who understand dataset types and structure before they start working make fewer errors and reach better answers faster.
What are the main types of data sets?
Three categories cover the vast majority of datasets analysts encounter in business settings: numerical, categorical, and multivariate.
Numerical datasets contain quantifiable values. Sales revenue by quarter, product weights, website session durations, and stock prices are all numerical. These datasets support regression analysis, forecasting, and statistical testing. The ggplot2 “Diamonds” dataset, a standard academic benchmark, contains about 53,940 rows of price, carat, and cut data. That scale makes it ideal for practicing visualization and regression techniques.
Categorical datasets use fixed, limited values. Employee satisfaction ratings like “Very poor,” “Poor,” “Neutral,” “Good,” and “Very good” are a classic categorical data set example. These datasets support frequency analysis, cross-tabulation, and qualitative segmentation. They tell you what kind rather than how much.
Multivariate datasets combine multiple variable types in a single table. A customer record with age (numerical), region (categorical), purchase frequency (numerical), and product category (categorical) is multivariate. These are the most common type in real business analytics because real decisions rarely depend on a single variable.
| Type | Key characteristic | Typical use case |
|---|---|---|
| Numerical | Quantifiable, continuous or discrete values | Forecasting, regression, trend analysis |
| Categorical | Fixed labels or groups | Segmentation, survey analysis, classification |
| Multivariate | Multiple variable types combined | Customer analytics, business intelligence |
Where can you find or create sample data sets?
The fastest path to a quality sample is a curated platform. Kaggle and Databricks both host datasets ranging from small subsets of 31 rows to large-scale benchmarks built for machine learning and SQL testing. Public GitHub repositories also offer domain-specific collections across healthcare, finance, and retail.
For skill-building, curated training datasets of 1,000 or more rows organized by industry give the most realistic practice. Sectors like retail, SaaS, and HR are well represented. A 31-row dataset teaches you syntax. A 1,000-row dataset teaches you to think about scale, outliers, and data quality.
When real-world data carries privacy risk, synthetic datasets are the professional answer. Synthetic data aids reproducibility and protects privacy, enabling cleaner algorithm testing. You control the variables, the distributions, and the edge cases. That control is something no scraped real-world dataset can offer.
Before you grab any dataset, run through this checklist:
- Define your analytical question first. The question determines the variable types you need.
- Confirm the dataset has enough rows to support your method. Regression models need more data than a simple frequency count.
- Check that categorical variables have enough distinct values to be meaningful.
- Verify the time range if you are doing trend or time-series analysis.
- Confirm the data source is documented and reproducible.
Pro Tip: Build a one-page brief before sourcing any dataset. Write down your question, the variable types required, the minimum row count, and the acceptable time range. Analysts who skip this step waste hours cleaning data that was never right for the job.
How do you prepare a dataset before analysis?
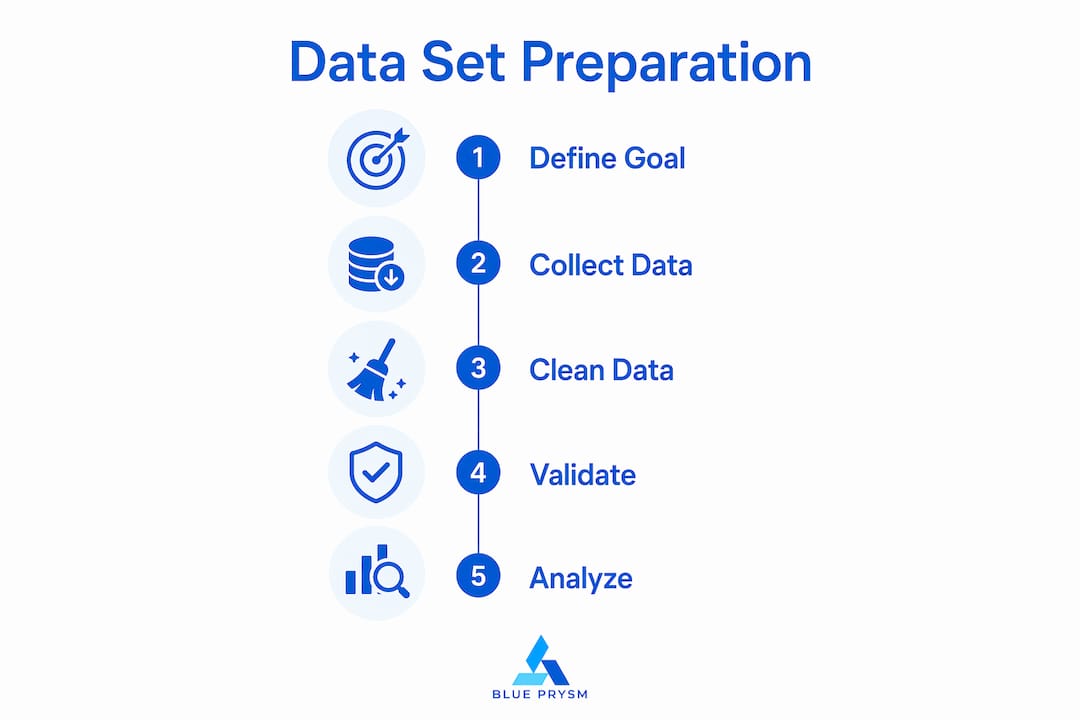
Preparation is where most analysis actually breaks down. A dataset that looks clean in a file manager can fail completely on import. The fix is systematic inspection before you load anything into a BI tool or analytics environment.

Data literacy depends on understanding dataset shape, types, and delimiters before importing. “Shape” means the number of rows and columns, the delimiter character (comma, semicolon, or tab), and the file encoding. UTF-8 BOM and semicolon delimiters are two of the most common reasons dataset loads fail in production pipelines. A file that opens fine in Excel may break entirely in Python or a SQL import tool.
Follow this workflow before importing any dataset:
- Open the raw file in a plain text editor. Confirm the delimiter and encoding visually.
- Count the header row fields and match them to the data dictionary.
- Check for null values in key columns before any transformation.
- Confirm date formats are consistent across all rows.
- Verify that categorical columns use consistent labels. “USA,” “U.S.A.,” and “United States” are three different values to a machine.
Without a data dictionary, interpreting complex datasets is error-prone and risks misinformed analyses. A column labeled “Score” means nothing without knowing whether it is a 1-to-5 rating, a percentile, or a raw test result. Always read the metadata first.
Pro Tip: When working with CSV files from international sources, always check the delimiter before import. European datasets frequently use semicolons instead of commas. One wrong assumption here corrupts an entire import.
What data set examples appear in business analytics?
Real business analytics relies on a short list of dataset types that appear across nearly every industry. Knowing these patterns helps you recognize what you are working with and what analysis is appropriate.
- Retail inventory datasets track SKU-level stock counts, reorder points, and supplier lead times. These are numerical and multivariate. They support demand forecasting and supply chain optimization.
- Customer satisfaction survey datasets use categorical scales. Net Promoter Score data, CSAT ratings, and product review scores all fall here. They answer “how do customers feel” rather than “how much did they spend.”
- Sales transaction datasets combine numerical values (revenue, units sold, discount applied) with categorical fields (product category, sales region, channel). They are the workhorse of business intelligence.
- HR and workforce datasets include headcount, tenure, department, and performance ratings. These multivariate datasets support workforce planning and retention analysis.
Dataset size shapes what analysis is possible. A 200-row sales dataset supports descriptive statistics. A 50,000-row dataset supports predictive modeling. Analysts who understand best data sets for business intelligence match their dataset scale to their method, not the other way around.
Blue Prysm applies this same logic to competitive and market intelligence data. Real-time market briefings and competitor monitoring generate structured datasets that feed directly into strategic decisions. The data is only as useful as the structure behind it.
Key Takeaways
Matching dataset type to analytical goal is the single most important decision in any data analysis project.
| Point | Details |
|---|---|
| Dataset type determines analysis | Choose numerical, categorical, or multivariate data based on your specific analytical question. |
| Source quality matters | Platforms like Kaggle and Databricks offer datasets from 31 rows to large-scale benchmarks for varied needs. |
| Synthetic data has real value | Synthetic datasets protect privacy and give controlled conditions for testing algorithms and pipelines. |
| Metadata is non-negotiable | Always read the data dictionary before analysis. Missing definitions make even clean data unreliable. |
| Preparation prevents failure | Check encoding, delimiters, and null values before import to avoid broken loads in BI tools. |
Why most analysts pick the wrong dataset first
I have watched analysts spend three days cleaning a dataset that was wrong for the job from the start. The data was real, large, and well-formatted. It was also the wrong type entirely. They needed time-series numerical data. They grabbed a categorical survey export because it was available.
The trap is availability bias. We reach for what is easy to find rather than what the question actually requires. Synthetic datasets get dismissed as “not real data,” but practitioners who use them for controlled testing handle data anomalies and edge cases without the noise of real-world inconsistency. That is not a shortcut. That is good methodology.
My honest advice: treat dataset selection as a design decision, not a logistics task. Write the question first. Define the variable types second. Find the data third. Analysts who reverse that order spend most of their time fixing problems that should never have existed. The best dataset is rarely the biggest one. It is the one that fits the question cleanly.
— Colin Bowdery
Blue Prysm turns raw market data into strategic intelligence
Most businesses collect data. Few structure it well enough to act on it. Blue Prysm’s AI-powered market research tools are built for strategy teams that need structured, reliable intelligence without the overhead of a full research department.
Blue Prysm pulls real-time market and competitor data into organized, analysis-ready formats. The platform applies the same discipline this article describes: structured variables, clear metadata, and consistent categorization. Teams using Blue Prysm’s competitive intelligence platform get briefings they can act on, not raw dumps they have to clean. If your current data workflow leaves you guessing, that is the problem Blue Prysm is built to fix.
FAQ
What is a data set in simple terms?
A data set is an organized collection of related data points stored in a structured format, such as rows and columns in a spreadsheet or database table. Analysts use datasets to identify patterns and support decisions.
What is a good data set example for beginners?
The ggplot2 “Diamonds” dataset, with roughly 53,940 rows of price, carat, and cut data, is a widely used benchmark for learning visualization and regression. Curated retail or HR datasets with 1,000 or more rows also work well for realistic practice.
What are the main types of data sets?
The three main types are numerical (quantifiable values like revenue or weight), categorical (fixed labels like survey ratings), and multivariate (multiple variable types combined in one table).
How do I avoid data import errors with CSV files?
Check the file encoding and delimiter in a plain text editor before importing. UTF-8 BOM encoding and semicolon delimiters are common causes of failed loads in BI tools and analytics pipelines.
When should I use synthetic data instead of real data?
Use synthetic data when real data carries privacy risk, when you need controlled test conditions, or when you want to isolate specific variable behaviors without cleaning noise from real-world inconsistencies.