
Start with a segmentation matrix paired with an editable spreadsheet. It gives you the fastest path from raw customer data to a scored, prioritized segment list. This article hands you fillable templates, three realistic filled examples, and the MASDA validation steps that separate a real segment from a wish list. If you want to scale past manual spreadsheets later, Blue Prysm’s AI-assisted templates handle the evidence gathering for you.
TL;DR:
- Using a segmentation matrix helps identify clear, data-backed customer groups quickly, especially for early-stage products aiming to target one to three segments.
- The core fields required are segment name, basis, evidence, size, priority, channels, and messaging, with optional metrics like churn risk or average order value enhancing prioritization.
- Segments must pass the MASDA test—being Measurable, Accessible, Substantial, Differentiable, and Actionable—to qualify for marketing investment.
- Manual evidence collection can be time-consuming, but AI-powered tools automate data gathering and keep segment insights current in real-time.
- Cloning templates in spreadsheet or visual formats facilitates collaboration and version control, supporting ongoing segmentation updates aligned with market shifts.
What Is a Market Segmentation Template?
A market segmentation template is a structured worksheet that forces you to define, size, and score customer groups before you spend a dollar on marketing or product work. That’s the practical goal: stop guessing which customers matter and start proving it with fields you can defend in a budget meeting. The template does the organizing; you still do the thinking.
You have four common formats to choose from, and picking the wrong one for your stage wastes weeks.
- 2×2 matrix: plots segments across two axes (often need versus value, or price sensitivity versus loyalty) and is the fastest way to visualize four to six groups at once.
- Spreadsheet table: rows are segments, columns are your criteria and scores. Best for teams that need to sort, filter, and share with finance or leadership.
- Layered persona profiles: one page per segment with narrative detail on motivations, objections, and buying triggers. Useful once you already have quantitative segments and need messaging depth.
- Firmographic template: built for B2B, tracking company size, industry, revenue band, and tech stack instead of individual demographics.
If you’re piloting segmentation for the first time, start with the matrix. It forces clarity fast. Common segmentation matrices divide customers along geographic, psychographic, behavioral, and demographic axes, which gives you a ready-made structure instead of a blank page. Move to the spreadsheet or persona formats once you need to defend the segments to a cross-functional team or track them over multiple quarters.
What Fields Belong in a Segmentation Template?
Every usable template answers the same seven questions before it earns a place in your strategy deck. Skip one of these and you’re building on a guess, not evidence.
- Segment name: short and memorable, not a data label. “Budget-Conscious Renovators” beats “Segment 3.”
- Segmentation basis: which quadrant you used, geographic, psychographic, behavioral, or demographic, so anyone auditing the template understands the logic.
- Evidence and data source: the survey, CRM export, or interview set that justifies the segment’s existence.
- Estimated size: a real number or range, not “large” or “growing.” If you can’t size it, you can’t prioritize it.
- Priority score: a simple 1 to 5 or weighted score based on your criteria.
- Target channels: where this segment actually spends attention, email, LinkedIn, retail, trade shows.
- Messaging hooks: the specific language or pain point that makes this segment respond.
Beyond that core seven, a few optional fields sharpen your decisions further: confidence level in the data, onboarding friction, churn risk, and average order value. None of these are decorative. Confidence level tells your team whether to run another round of research before committing budget. Churn risk tells product whether a segment is worth a retention feature or a one-time acquisition push. Average order value tells finance whether the segment justifies a dedicated sales motion.
Pro Tip: Add a “last validated” date field to every segment row. Segments decay. A segment that was accurate in January can be stale by August if a competitor changes pricing or a channel algorithm shifts.

How Do You Build and Prioritize Segments With a Template?
Populating a template is not a data-entry task. It’s a five-step research sprint, and skipping steps is how teams end up with segments that look tidy on paper and fall apart in the market.
- Decide your research objective and scope. Are you segmenting to find a new market entry point, or to sharpen targeting in an existing one? The answer changes which data you collect.
- Gather data sources and map them to template fields. Pull quantitative data (CRM records, web analytics, purchase history) and qualitative data (support tickets, sales call notes, interviews) into the same sheet. A documented segmentation process treats objective setting, data collection, clustering, and testing as sequential steps, not a single afternoon task.
- Cluster inputs into candidate segments. Group customers who share behavior or need patterns, not just demographics that happen to look similar on a spreadsheet.
- Apply MASDA tests and run quick validation experiments. Each candidate segment needs a fast reality check before it gets budget.
- Score and prioritize, then build an activation checklist. Rank surviving segments by size, priority score, and ease of reaching them, and attach a concrete next action to each one.
A template paired with a focused one-sprint pilot tends to produce a prioritized activation checklist tied to a measurable KPI, rather than a slide that gets filed away. That single distinction, sprint versus slide, is what determines whether the exercise changes anything.
If you’re building for an early-stage product, resist the urge to chase every segment you find. Product teams working toward their first $5 million in annual recurring revenue tend to see better results limiting focus to one to three segments before expanding once one is validated.

Three Filled Segmentation Template Examples
Seeing a filled example is worth more than another blank template. Here are three realistic samples across the formats readers use most.
- B2C 2×2 matrix: axes are “price sensitivity” (low to high) and “brand loyalty” (low to high). The high-loyalty, low-price-sensitivity quadrant holds “Premium Repeat Buyers,” sized at 12% of the customer base, priority score 5, because they generate the highest lifetime value with the least acquisition spend.
- B2B firmographic table: a row for “Mid-Market SaaS” scores well because the segment shows short sales cycles and low churn, based on closed-won deal data.
- Psychographic persona: “Efficiency-Driven Ops Manager,” motivated by reducing manual reporting time, objects to “another tool to learn,” and responds to messaging around time saved per week rather than feature lists.
What Makes a Segment Actually Usable? The MASDA Test
Not every group that looks like a segment on paper survives contact with a real budget decision. That’s where the MASDA framework earns its place in your process.
A segment that fails even one MASDA test isn’t a segment yet. It’s a hypothesis wearing a segment’s clothes, and treating it as finished is how marketing budgets get spent on audiences that were never reachable in the first place.
The MASDA criteria require each segment to be Measurable, Accessible, Substantial, Differentiable, and Actionable. Run through each letter as a quick check: can you size it with real data (Measurable)? Can you actually reach it through a channel you control (Accessible)? Is it big enough to justify the investment (Substantial)? Does it respond differently than other segments to your offer (Differentiable)? Can your team act on it this quarter (Actionable)? A checklist run against this framework quickly separates segments worth funding from ones that only look promising in a workshop.
Once a segment passes, resist the temptation to build a roadmap that tries to please everyone at once. Roadmap decisions should reflect the priorities of your validated segments rather than aggregating every feature request across your entire customer base. Track two or three KPIs per segment, conversion rate, retention, and average order value are common choices, and review them on a monthly cadence for new segments, quarterly once they stabilize.
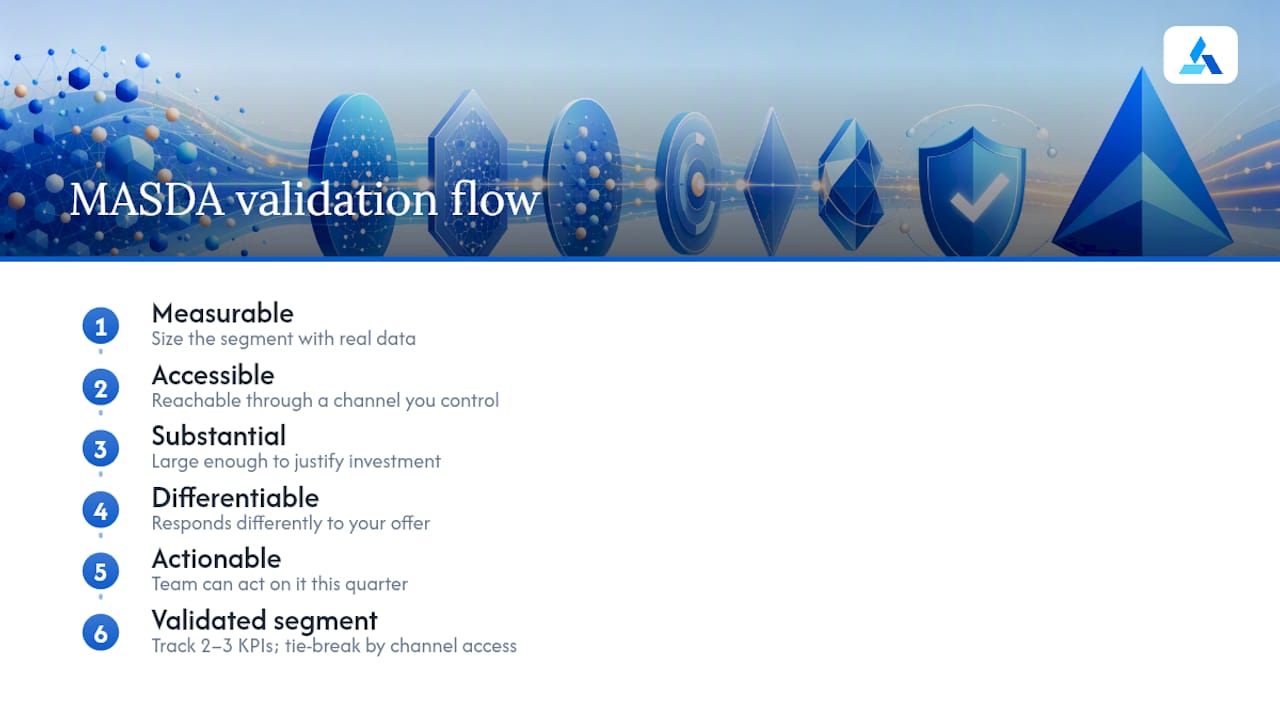
Pro Tip: If two segments both score a 4 on priority, break the tie by channel access, not size. The segment you can reach cheaply this quarter beats the bigger one you can’t touch until next year’s budget.
Which Template File Formats Should You Clone?
The right file format depends on who needs to touch the template after you build it, not just who builds it first.
- Google Sheets or Excel: best for pilots and solo analysis, since scoring formulas update automatically as you add data.
- Slide decks: best for presenting finalized segments to leadership, one segment per slide with the persona and priority score visible.
- Miro or a similar visual board: best for cross-functional workshops where marketing, sales, and product need to cluster and re-cluster segments together in real time.
- Downloadable starter templates give you a structure to clone instead of building from a blank page, which saves the hour you’d otherwise spend just formatting columns.
Store the working file in a shared drive with version tags in the filename, like “segments_v3_validated,” so nobody markets against a stale, unvalidated draft. Once segments turn into campaigns, a marketing brief template keeps the handoff from segmentation to execution from losing detail in translation.
Where Templates Fit in an AI-Enabled Segmentation Workflow
Templates solve structure. They don’t solve the slowest part of segmentation: gathering enough evidence to fill the fields honestly. That’s where AI-assisted evidence collection changes the math, surfacing behavioral and firmographic signals from public and first-party data instead of you manually cross-referencing spreadsheets for a week.
Blue Prysm’s platform plugs into this exact gap, populating evidence fields and flagging emerging segments as market conditions shift. Templates fit into a repeatable market opportunity assessment workflow as the structure; the automation is what keeps that structure current instead of stale by next quarter.
— Colin Bowdery
Automate the Evidence, Not Just the Template
A blank spreadsheet still requires someone to manually pull CRM exports, survey responses, and support tickets before a single field gets filled in honestly. Blue Prysm is built for the part templates can’t do on their own: surfacing the evidence in real time so your segments stay accurate instead of aging out by the time you present them.
The market research tools inside Blue Prysm pull behavioral and firmographic signals automatically, feeding straight into your segmentation fields instead of leaving you to hunt for data across five different systems. Pair that with the market analysis platform and you get segment tracking that updates as your market moves, not once a year when someone remembers to rerun the spreadsheet. Teams that also want a framework library to act on validated segments can review 95+ business strategy frameworks built to turn a scored segment into a roadmap decision.
| Approach | Manual template | Blue Prysm AI-enabled workflow |
|---|---|---|
| Evidence collection | Manual export and cross-reference | Automated signal surfacing |
| Update frequency | Whenever someone remembers | Continuous |
| Cross-functional sharing | Static file, version drift risk | Centralized, live dashboard |
| Time to first validated segment | Days to weeks | Hours |
Start with the free how it works overview to see how a first segment moves from raw data to a validated, actionable row in under a day.
Sources
For deeper reading: the MASDA validation framework, the Process Street segmentation analysis template for the step-by-step workflow, the Miro segmentation matrix for a cloneable quadrant layout, and IdeaPlan’s product-focused template for B2B scoring guidance. Marketers targeting decision-makers through search may also find SEO tactics for reaching B2B buyers useful once segments turn into campaigns.
- Market Segmentation Analysis Template | Process Street
- Market Segmentation Matrix Templates & Examples | Miro
- Market Segmentation Template | EdrawMind
FAQ
What are the five methods of market segmentation?
The five most commonly cited methods are geographic, demographic, psychographic, behavioral, and firmographic segmentation, with firmographic reserved specifically for B2B markets that segment by company traits instead of individual traits.
Can you give an example of market segmentation?
A software company might segment customers into “mid-market SaaS” and “enterprise” segments, scoring each on deal cycle length and churn to decide where sales effort pays off fastest.
What are the four main types of market segmentation?
The four primary bases are geographic, psychographic, behavioral, and demographic, and most segmentation matrix templates are built around these four axes.
How do you actually do a market segmentation?
Set a clear research objective, gather quantitative and qualitative data, cluster customers into candidate segments, run each candidate through the MASDA test, then score and prioritize the ones that pass.
Do I need special software to build a segmentation template?
No. A spreadsheet or a visual board like Miro works fine for manual segmentation, though AI-assisted platforms like Blue Prysm reduce the time spent gathering evidence to fill the template’s fields.