
A North Star metric is the single, company-wide number that measures the real value your product delivers to customers, and it’s designed to move before revenue does. It is not revenue, and it doesn’t replace your KPIs. Done right, it’s measurable, something your teams can actually influence, and it tells you something is wrong months before your bank account does.
TL;DR:
- A good North Star metric reflects customer value, moves ahead of revenue, and can be influenced by multiple teams through measurable inputs.
- It should be a leading indicator with measurable movement within two to four weeks, linked to specific input metrics owned by different functions.
- Choice criteria include clear correlation with retention or revenue, simplicity of calculation, and resistance to gaming or superficial actions.
- Regular review and updates are crucial, with a cadence of at least quarterly, especially after shifts in business model or customer segments.
- Using a structured process and tools like Blue Prysm helps ensure consistent, aligned, and meaningful tracking of the North Star metric.
What Is a North Star Metric and Why Does It Matter?
Most companies drown in dashboards and still can’t answer a simple question: are we actually winning? A North Star metric fixes that by giving every team, from engineering to marketing, one shared number that reflects genuine customer value rather than internal busywork.
The payoff shows up in three places.
Alignment. When product, growth, and engineering all report into the same number, arguments about priority get shorter. Nobody has to guess whether a feature “matters” because the metric tree already tells them whether it moves the needle.
Early warning. Revenue is a lagging indicator. By the time it drops, the damage is already done. A well-chosen NSM, because it’s tied to a leading behavior like weekly active usage or completed transactions, tends to shift weeks or months before the income statement notices.
Focus. Roadmaps stop being wish lists. When a proposed feature can’t be traced to a plausible lift in the NSM or one of its input metrics, it gets deprioritized instead of debated for the fifth time in a planning meeting.
There’s a quieter benefit too: teams anchored to a clear NSM tend to burn less time in status meetings, because the metric itself answers “how are we doing” without a slide deck. That’s not a minor efficiency gain. It’s hours back in the week for people who’d rather be building.
- Gives every function a shared definition of “winning”
- Surfaces problems before revenue reflects them
- Cuts down on roadmap debates that have no measurable anchor
- Reduces time spent reconciling conflicting dashboards across teams
What Makes a North Star Metric Actually Good?
Plenty of metrics look impressive on a slide and fail the moment someone tries to run the business on them. Four criteria separate a durable NSM from a vanity number.
- It reflects customer value, not company activity. “Total sign-ups” measures your funnel, not whether anyone got value. “Weekly active teams completing a core workflow” measures the thing customers actually came for.
- It’s a leading indicator. A strong NSM moves ahead of retention and revenue, not alongside them, so it functions as an early warning system rather than a scoreboard you check after the game.
- It’s measurable from a single source of truth. If your product team and your finance team calculate the same metric two different ways, you don’t have a North Star. You have a dispute waiting to happen.
- It’s influenceable by multiple teams and hard to game. A good NSM has enough surface area that engineering, growth, and support can each pull a lever that moves it, and it moves often enough that you can actually test whether an experiment worked.
Pro Tip: If a candidate metric only changes on a quarterly cadence, it’s too slow to guide weekly experiments. Look for something with movement you can see inside a two-to-four week sprint cycle.
Balance matters here too. The strongest NSMs weigh quantity, quality, and frequency together, not just raw volume, so a business optimizing purely for signups without checking whether those users stick around is measuring the wrong half of the story.
How Do You Choose the Right North Star Metric?
Choosing a North Star metric isn’t a brainstorming exercise. It’s a five-step process with data checkpoints built in.
- Write your value statement. Start with a single sentence: “Our product helps [customer] achieve [outcome].” This forces clarity before you touch a spreadsheet. A project management tool might write, “Our product helps busy teams ship work without missing deadlines.”
- Generate three to five candidates. From that value statement, list every metric that could plausibly represent the outcome, then run each one against the four criteria above. Most candidates fail on the first pass.
- Test historical correlation. Pull past data and check whether your leading candidates actually predicted retention or revenue changes historically. Run segmentation checks across acquisition channel, geography, and plan tier, because a metric that only correlates for your highest-paying segment isn’t a company-wide North Star. It’s a whale-tracking tool.
- Build the metric tree. Map three to five input metrics that feed your NSM, assign an owning team to each one, and connect them to your quarterly OKRs so the abstraction has teeth.
- Set a review cadence. Revisit the NSM quarterly at minimum, and define upfront what would trigger a change: a pivot in business model, a new customer segment, or evidence the correlation has broken down.
- Value statement first, metrics second, never the reverse
- Correlation testing before commitment, not after
- Named owners for every input metric, not just the top-level NSM
- A pre-agreed trigger for when the NSM itself needs to change
What Does a North Star Metric Tree Look Like by Business Model?
A metric tree connects your top-level NSM to the input metrics that individual teams can actually push on. The structure is always the same shape: one North Star at the top, three to five drivers feeding into it, and each driver owned by a specific function. What changes is what sits at each level, depending on how your business creates value.

SaaS example. A B2B software company might set its NSM as weekly active teams completing a core workflow. The inputs feeding that number typically include onboarding completion rate, activation rate within the first seven days, and retention at day 30. Customer success owns onboarding, product owns activation, and growth owns the day 30 number.
Marketplace example. A two-sided marketplace often centers its NSM on weekly completed transactions, since that single number reflects both supply and demand working together. The drivers underneath usually split into buyer activation rate and seller retention, because a marketplace that loses sellers faster than it gains buyers is dying quietly no matter what the top-line transaction count says this month.
Content or media example. A streaming or publishing product frequently anchors its NSM on minutes consumed per active user, since that’s the closest proxy to “did we actually deliver value” rather than “did someone open the app.” Sessions per week and 30-day retention typically feed that number from below.
Ecommerce example. A direct-to-consumer retailer might use purchasing customers per month as its NSM, since it captures repeat behavior rather than one-time traffic spikes. Add-to-cart rate and checkout conversion usually sit underneath as the levers merchandising and engineering teams can each push.
- SaaS: weekly active teams → onboarding completion, activation, D30 retention
- Marketplace: weekly completed transactions → buyer activation, seller retention
- Content/media: minutes consumed per active user → sessions per week, retention
- Ecommerce: purchasing customers per month → add-to-cart rate, checkout conversion
Notice what none of these examples use as the top-level number: revenue, signups, or downloads. Those are outcomes or vanity counts. The NSM sits one layer closer to genuine customer behavior.
How Does a North Star Metric Relate to KPIs and OKRs?
Confusion here kills more NSM programs than bad metric selection does. The three tools answer different questions, and none of them replaces the others.
Your North Star metric answers “are we creating lasting customer value?” It’s one number, company-wide, reviewed quarterly. KPIs answer “is this specific team or function on track?” They’re plural, team-specific, and tied to hard targets like churn rate, support response time, or monthly recurring revenue. OKRs answer “what are we doing this quarter to move the number?” They’re the objectives and initiatives that translate NSM movement into weekly work.
In practice, translation looks like this: if your NSM is weekly active teams completing a workflow, a customer success team’s OKR might be “increase onboarding completion rate from 62% to 75%,” with a supporting KPI dashboard tracking time-to-first-value daily. Common customer success KPIs like health score, NPS, and churn serve as guardrails, catching damage the NSM alone might miss.
- NSM: one company-wide number, reviewed quarterly, tied to customer value
- KPIs: team-level targets that guardrail against unintended side effects
- OKRs: the quarterly work that’s supposed to move the NSM
- Dashboards need one calculation source. Two teams computing the same metric differently is a governance failure waiting to surface in a board meeting
Building the dashboard is only half the job. Someone still has to maintain a written calculation document defining exactly which events and filters feed the number, because metric drift is silent until it isn’t. Teams building this kind of KPI dashboard discipline tend to catch drift months before it becomes a strategy-meeting surprise.
What Mistakes Sink a North Star Metric Program?
The two most common failures are almost mirror images of each other, and both are worth running through a puffery detector before you commit to them internally.
The first mistake is choosing revenue, or another lagging, output-only number, as the NSM. Revenue tells you what already happened. It can’t tell you what to fix, because a dozen different problems can produce the same revenue dip.
The second is the opposite failure: building an NSM formula so complicated that nobody outside the analytics team can explain it in one sentence. If your customer support lead can’t repeat the metric definition from memory, the metric has already lost the organization.
Gaming risk deserves its own warning. A metric like “sign-ups” invites growth teams to juice the top of the funnel with incentives that produce users who never return. A well-built NSM resists this because it’s tied to sustained behavior, not a one-time action.
- Guardrail KPIs (churn, NPS, support tickets) catch damage the NSM alone might hide
- A written calculation document prevents teams from quietly redefining the metric
- Periodic audits of the underlying event data catch drift before it compounds
- Clear ownership rules stop teams from optimizing their input metric at the NSM’s expense
Pro Tip: Run every proposed NSM through a simple test before you commit: could a team hit this number while customers get objectively less value? If yes, keep iterating.
How Blue Prysm Supports North Star Metric Selection and Monitoring
Blue Prysm’s market research tools and strategy framework library were built for exactly the workflow above, without requiring a data science team to run it.
A typical workflow inside the platform looks like this: write your value statement using a guided template, generate candidate metrics against your own market data, run a correlation check against historical retention patterns, then drop the winning metric into a pre-built metric tree template with owners assigned. Automated competitive intelligence briefings keep flagging whether your NSM is holding up against how competitors are moving in the same category.
- Templates translate a value statement into testable NSM candidates
- Metric-tree templates map input metrics to owners automatically
- Execution dashboards track the NSM alongside guardrail KPIs in one view
What I’ve Learned Watching Teams Actually Run This
The teams that succeed treat the North Star as a weekly ritual, not a slide from last quarter’s kickoff. The ones that stall pick a metric everyone loves in theory and nobody checks in practice. Put the number on the wall. Reference it in every planning conversation. Retire it the moment it stops correlating with the outcome you actually care about.
— Colin Bowdery
A Different Way to Build and Track Your North Star Metric
Most guides stop at “pick your metric and build a spreadsheet.” That works until your team grows past six people and three of them are calculating the same number differently. Blue Prysm gives you the templates, the correlation testing structure, and the dashboarding in one place, so you spend your time interpreting the number instead of arguing about how it’s calculated.
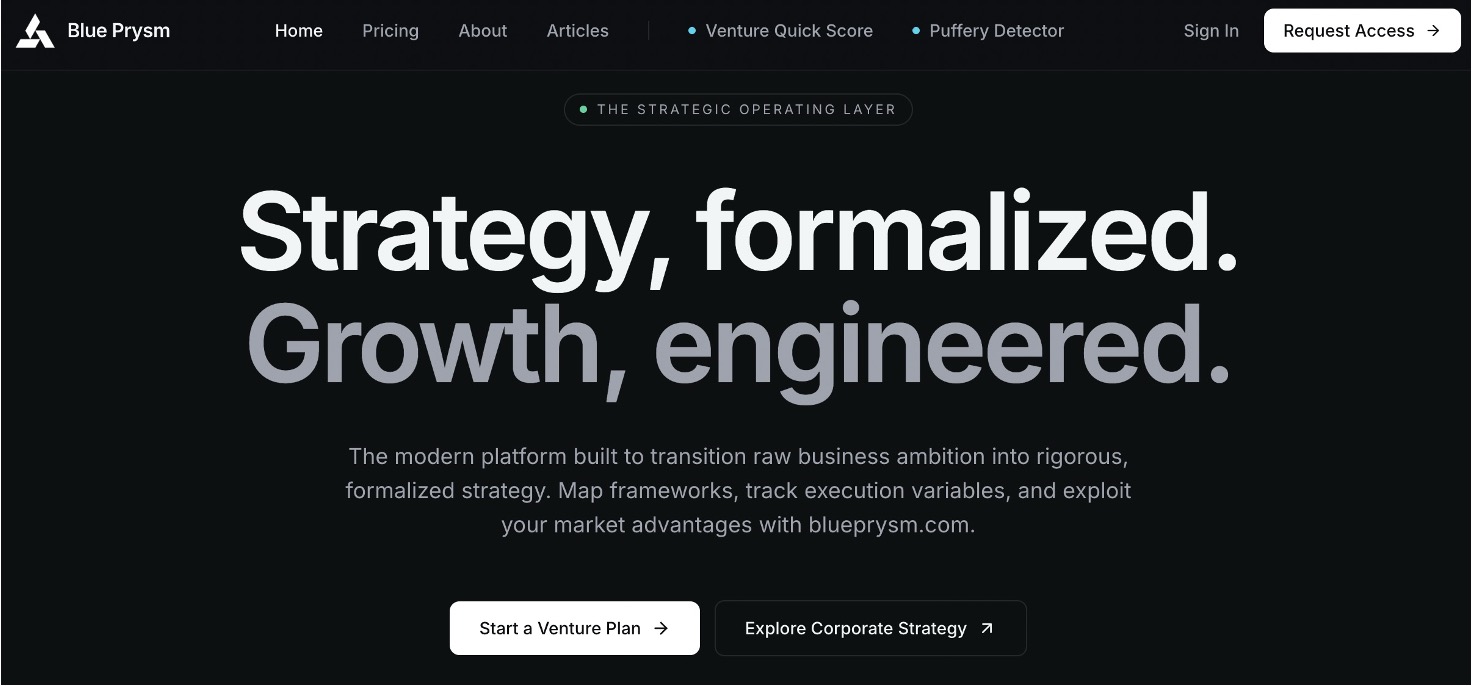
If you’re still doing this manually in spreadsheets shared across Slack threads, a platform starts to make sense once more than two teams need to see the same number the same way. Blue Prysm’s market analysis platform pairs real-time competitor tracking with the strategy templates that turn a value statement into a working metric tree, complete with owners and review cadence built in. For teams that want an outside read before committing, the how it works page walks through the full process from value statement to dashboard. Start there if you want to see whether your current North Star candidate would survive a correlation test.
Sources
- North Star Metric: How to Choose Yours (With Examples) | Rework Resources
- North Star Metric: Definition, Framework & Examples | Growth Method
- What is a North Star metric? | Signals & Stories (Mixpanel)
- KPIs: What Are Key Performance Indicators? Types and Examples | Investopedia
FAQ
What Is the Difference Between a KPI and a North Star Metric?
A North Star metric is one company-wide number tied to customer value, while KPIs are team- or function-specific measures tied to concrete targets, like churn rate or support response time, that act as guardrails around the NSM.
What Is Netflix’s North Star Metric?
Netflix has been widely reported to center its focus on hours streamed or engagement per subscriber, a leading-indicator approach consistent with the content and media metric-tree pattern of tracking minutes consumed per active user rather than raw subscriber counts.
Can a North Star Metric Change Over Time?
Yes. A North Star metric should be revisited on at least a quarterly cadence, and changed when the business model pivots, the correlation with retention breaks down, or the company enters a genuinely new customer segment.
How Many Input Metrics Should Feed a North Star Metric?
Most metric trees work best with three to five input metrics, enough to give multiple teams a lever to pull without diluting ownership or making the tree too complex to track weekly.
Can Blue Prysm Help Us Test Correlation Before Committing to a Metric?
Yes. Blue Prysm’s strategy templates and market research tools are built to help teams generate candidate metrics, run historical correlation checks, and build the metric tree in one workflow rather than stitching it together across spreadsheets.