
TL;DR:
- Choosing data sets aligned with clear business questions is crucial for meaningful analysis.
- Document every transformation to ensure results are reproducible and trustworthy.
A data set to analyze is a structured collection of information selected to answer a specific business or research question. The right choice determines whether your analysis produces real insight or just noise. Business intelligence professionals who pick data sets without matching them to their analytics goals — descriptive, diagnostic, predictive, or prescriptive — waste time cleaning data that was never fit for purpose. This guide cuts through that trap by mapping the best public, open source, and real-world data sets to the specific outcomes you actually need.
1. What are the best data sets to analyze for building skills?
Beginner-friendly data sets share three traits: small file size, clean formatting, and clear documentation. These traits let you focus on the full analytical workflow rather than getting stuck in preprocessing.
- FiveThirtyEight publishes data behind its journalism, including sports, politics, and economics. Files are small, well-labeled, and perfect for data visualization projects.
- UCI Machine Learning Repository hosts hundreds of structured data sets across health, finance, and social science. Most include a data dictionary and clear variable definitions.
- Data.gov provides U.S. federal data across dozens of categories. The documentation quality varies, but the most-downloaded sets are consistently clean.
The goal at this stage is not complexity. It is completing an end-to-end workflow: load, clean, analyze, and present. That discipline matters more than the size of the data.
Pro Tip: Pick one data set and take it all the way to a finished chart or report before moving to the next. Analysts who finish small projects consistently outperform those who start large ones and abandon them.

2. Which advanced data sets support strategic forecasting?
Real business problems require real business data. Transactional sales records, logistics data, and inventory histories are the data sets where predictive and prescriptive analytics earn their keep.
- Transactional sales data by SKU enables demand forecasting. Predictive analytics applied to this type of data reduces overstock by 22%, directly improving inventory turnover.
- Logistics and fleet data including traffic patterns and fuel costs supports route optimization. Applying predictive models to this data reduces delivery times by 15%.
- Multi-source customer data combining CRM records, web behavior, and purchase history enables churn prediction and lifetime value modeling.
The trap most analysts fall into with advanced data sets is skipping problem framing. Before you touch the data, write down the specific business question you are answering and the metric you will use to evaluate success. Without that, you are just exploring, not analyzing.
Pro Tip: Document every merge, transformation, and calculated field as you build. Documenting your data cleaning process is not busywork. It is the difference between a reproducible analysis and one you cannot defend six months later.
3. What public and open source repositories offer the best data sets for research?
Public repositories are the fastest path to high-quality, free data. The best ones follow FAIR data principles: Findable, Accessible, Interoperable, and Reusable. FAIR compliance means the data has stable identifiers, clear licensing, and metadata that makes it usable across tools and teams.
| Repository | Best for | Documentation quality | Data volume |
|---|---|---|---|
| Kaggle | Machine learning, competitions | High | Very large |
| Data.gov | U.S. government, policy, economics | Medium to high | Large |
| UCI Repository | Academic, structured ML data | High | Medium |
| Harvard Dataverse | Social science, research replication | Very high | Medium |
Each repository serves a different analytical purpose. Kaggle excels for machine learning projects where labeled data and community benchmarks matter. Harvard Dataverse is the right choice when you need peer-reviewed, citable data for formal research. Data.gov is unmatched for economic, demographic, and environmental analysis tied to U.S. markets.
The common mistake is treating all public data as equivalent. A data set with no metadata, no update history, and no stated methodology is a liability, not an asset.
4. How to evaluate and select data sets for your analysis goals
Choosing a data set without a framework is how analysts end up three weeks into a project with unusable results. The right selection process starts with problem framing and works backward to the data.
- Define your question first. Write one sentence describing what decision this analysis will inform.
- Check data coverage. Does the data span the time period and geography relevant to your question?
- Review the data dictionary. If there is no data dictionary, treat the data set as undocumented and proceed with caution.
- Assess data freshness. A customer behavior data set from 2019 will not reflect post-pandemic purchasing patterns.
- Match complexity to resources. A 10-million-row data set is not better than a 50,000-row one if you cannot process it within your project timeline.
Mismatches between data and goals produce predictable failures. Using a data set with poorly defined labels for a classification model, for example, produces predictions that look confident but are statistically indefensible. Modeling judgment and evaluation discipline matter more to employers and stakeholders than the sophistication of the algorithm you chose.
Pro Tip: Before committing to a data set, run a quick descriptive analytics check: count rows, check for nulls, and plot distributions. Five minutes of profiling prevents five days of rework.
5. How to use diagnostic analytics to find the “why” in your data
Descriptive analytics tells you what happened. Diagnostic analytics tells you why. The distinction matters because most business decisions require the “why” before any action makes sense.
A classic example: a 20% drop in Q4 sales looks alarming in a summary report. Diagnostic analysis of the same data, segmented by region, channel, and product category, reveals whether the drop came from a supply disruption, a competitor promotion, or a seasonal shift. Each cause demands a different response. Analysts who stop at the descriptive layer hand decision-makers a problem without a path forward.
The best data sets for diagnostic work include time-stamped transaction records, customer segmentation data, and operational logs. These allow you to slice across dimensions and isolate root causes rather than just confirming that something went wrong.
Key Takeaways
The most effective approach to analyzing data sets is to match the data to a specific business question before selecting a source, then document every transformation to keep results defensible.
| Point | Details |
|---|---|
| Match data to your question | Define the business decision first, then select a data set that covers the right scope and time period. |
| Start clean, then scale | Begin with small, clean sets and progress to complex, multi-source data as your workflow matures. |
| Use FAIR-compliant repositories | Kaggle, Data.gov, UCI, and Harvard Dataverse provide documented, reliable data for professional analysis. |
| Document every transformation | Recording your cleaning and merging steps makes analysis reproducible and builds stakeholder trust. |
| Prioritize evaluation discipline | Clear labels, defined metrics, and defensible evaluation matter more than algorithm complexity. |
Why most analysts pick the wrong data set first
The honest truth is that data set selection is where most analysis projects fail, and it happens before a single line of code is written. I have seen experienced analysts spend weeks on a project only to realize the data set they chose did not actually contain the variable that answered the business question. That is not a technical failure. It is a framing failure.
The progression from clean to complex data is not just a learning curve. It is a discipline. Real-world analytical value lives in messy, multi-source data, but you cannot handle that complexity without first mastering workflow on something manageable. The analysts who skip that step tend to produce work that looks impressive in a notebook and falls apart in production.
What I find most underrated is the data dictionary. Analysts treat it as optional documentation. It is not. A data set without a dictionary is a data set you do not fully understand, and analysis built on misunderstood variables produces confident-sounding nonsense. Check the dictionary before you check the row count.
The other thing worth saying plainly: employers and clients do not care how sophisticated your model is. They care whether your conclusions hold up under scrutiny. Demonstrating that you chose the right data, cleaned it transparently, and evaluated your results honestly is the actual skill being tested.
— Colin Bowdery
How Blue Prysm turns raw data into real strategic decisions
Finding the right data is only half the problem. The other half is turning it into a decision your team can act on, fast.
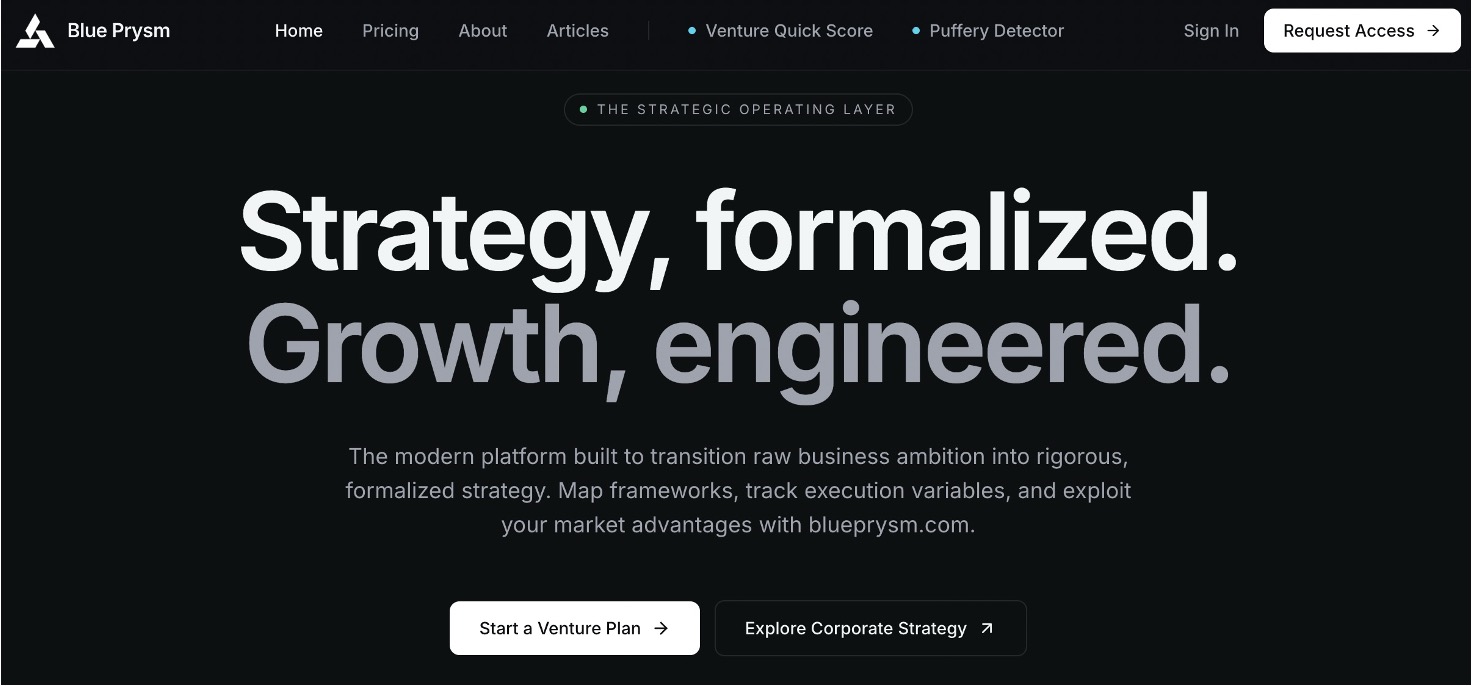
Blue Prysm’s market analysis platform connects your data inputs to AI-powered briefings, competitor monitoring, and structured strategy frameworks, all without a consulting retainer. Strategy teams use it to move from raw market data to a formatted intelligence report in hours, not weeks. If your team is sitting on good data but struggling to extract a clear direction, Blue Prysm’s AI-powered research tools give you the analytical infrastructure to close that gap.
FAQ
What makes a data set good for business intelligence?
A good business intelligence data set has clear documentation, defined variables, and coverage that matches your specific business question. FAIR-compliant repositories like Data.gov and Harvard Dataverse are reliable starting points.
How do I choose between descriptive and predictive data sets?
Choose descriptive data sets when you need to report on past performance. Use predictive data sets, typically time-series or transactional records, when you need to forecast demand, churn, or operational outcomes.
What are the best free public data sets for market analysis?
Kaggle, Data.gov, and the UCI Machine Learning Repository offer high-quality, free data sets covering economics, consumer behavior, and industry trends. Each has different strengths depending on your analytical goal.
How do I know if a data set is reliable enough to use?
Check for a data dictionary, a stated methodology, and a clear update history. Data sets without these three elements carry significant risk of producing misleading results.
What is the difference between open source data and public data sets?
Open source data is released under a license permitting free use, modification, and redistribution. Public data sets are government or institutional data made available to the public, but licensing terms vary and should be checked before use.