
TL;DR:
- A seven-stage, hypothesis-driven process enables teams to assess market opportunities and create a 90-day pilot plan in a few weeks. It emphasizes primary validation, realistic sizing, and evidence-backed scoring to make confident, auditable decisions. Blue Prysm’s AI tools automate research and scoring, helping SMBs run faster, live assessments.
A repeatable market opportunity assessment workflow is a 7-stage, hypothesis-driven process that moves your team from a raw idea to a go/iterate/no-go decision and a prioritized 90-day pilot roadmap, typically in 2–8 weeks depending on scope. Think of it as your strategic GPS: it tells you not just whether a market exists, but whether you can win in it, at what cost, and by when.
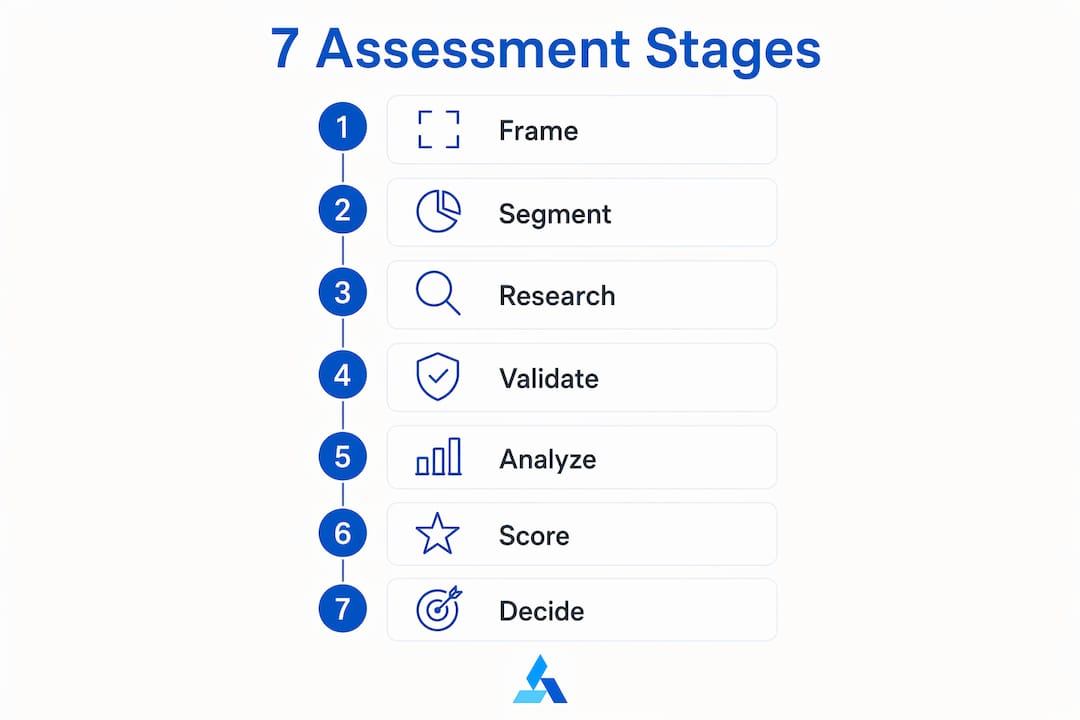
Here’s the workflow at a glance — copy this into your next strategy brief:
- Frame the decision and success criteria
- Define the market and target segment
- Research secondary data and competitive signals
- Validate with primary research (interviews, surveys, experiments)
- Size the opportunity (TAM, SAM, SOM)
- Prioritize using a scoring matrix
- Roadmap the 90-day pilot plan
The outputs you’re building toward: a decision recommendation, a prioritized pilot list, a 90-day roadmap, and a documented assumptions log. A living assessment process — one that gets updated as evidence comes in, not filed away after the kickoff meeting — is what separates teams that act with confidence from those that spin in analysis paralysis. Blue Prysm’s Agentic AI capabilities are built specifically to keep that process live: surfacing competitive signals, synthesizing CRM evidence, and flagging when your assumptions need revisiting.
What does a step-by-step market opportunity assessment workflow look like?
The seven stages aren’t arbitrary. Each one produces a specific deliverable, has a clear owner, and has a natural stopping point. Here’s how to run them in an SMB context.
Stage checklist and timebox guide
- Stage 1 — Frame the decision (Days 1–3, Strategy Lead): Write a one-sentence hypothesis (“We believe [segment] will pay [price] for [solution] because [reason]”). Define what a “go” looks like before you start. Deliverable: decision brief with success criteria.
- Stage 2 — Define the market and segment (Days 3–5, Strategy + Product): Narrow the ICP (ideal customer profile), map the buying process, and set the market boundaries you’ll size. Deliverable: segment definition memo.
- Stage 3 — Secondary research (Days 5–10, Analyst): Pull industry reports, public filings, search demand data, and competitor pricing pages. Deliverable: research summary with source log.
- Stage 4 — Primary validation (Days 10–21, Sales + Product): Run 10–20 interviews and at least two lightweight experiments (for example, a demand signal test and a concierge pilot). Deliverable: interview synthesis and experiment results.
- Stage 5 — Size the opportunity (Days 15–22, Strategy): Build TAM/SAM/SOM estimates using both top-down and bottom-up methods. Deliverable: sizing model with sensitivity table.
- Stage 6 — Competitive reality check (Days 18–24, Strategy + Sales): Map direct rivals, status-quo alternatives, and structural substitutes. Deliverable: competitive landscape summary and white-space notes.
- Stage 7 — Prioritize and recommend (Days 22–28, Strategy Lead): Score opportunities against the matrix, apply decision rules, and draft the 90-day roadmap. Deliverable: recommendation memo and pilot plan.
A market assessment should be treated as a living operating process, not a static report. Build in a weekly 30-minute assumption-review checkpoint from Day 10 onward.
Pro Tip: Set your success criteria in Stage 1, not Stage 7. Deciding what “good enough” looks like before you see the data is the single most effective way to prevent the assessment from drifting into confirmation bias territory.

How do you size a market without falling into the TAM trap?
Magical TAM is one of the most common credibility killers in a strategy review. “The global market is $50 billion, so we only need 1% to win” is not a sizing model. It’s a gut feeling dressed up in a spreadsheet. Here’s how to do it properly.

TAM, SAM, SOM defined
TAM (Total Addressable Market): The total revenue opportunity if you captured 100% of the market. Useful for framing, not for budgeting.
SAM (Serviceable Addressable Market): The portion of TAM you can realistically reach with your current GTM model and geography.
SOM (Serviceable Obtainable Market): The slice of SAM you can realistically capture in the next 12–24 months given your resources, conversion rates, and competitive position. This is the number that drives your unit economics.
Two methods: top-down and bottom-up
Top-down approach: Start with a credible industry total from a named source (IBISWorld, Statista, public filings), then apply filters for geography, segment, and product fit.
Example: U.S. SMB project management software market = $4.2B. Filter for companies with 10–200 employees in professional services = ~18% of that segment = $756M SAM. Apply a realistic 1.5% capture rate in Year 1 = $11.3M SOM.
Bottom-up approach: Start from the customer level and build up.
Example: 12,000 reachable companies in your ICP (sourced from LinkedIn Sales Navigator + CRM pipeline). Average contract value = $8,400/year. Estimated conversion rate from outreach = 2.5%. SOM = 12,000 × $8,400 × 2.5% = $2.52M Year 1.
The reconciliation step matters. If your top-down SOM is $11.3M and your bottom-up SOM is $2.52M, the gap tells you something: either your conversion assumptions are conservative, your reachable universe is too narrow, or your top-down filter was too loose. Use both methods and reconcile them before presenting a number to leadership.
Sensitivity table: how assumptions move your SOM
| Assumption | Base Case | Downside | Upside |
|---|---|---|---|
| Reachable accounts | 12,000 | — | — |
| Conversion rate | 2.5% | 1.5% | 2.5% |
| Average contract value | $8,400 | $8,400 | $11.3M |
| SOM (Year 1) | $2.52M | $558K | — |
The downside scenario is your floor. If the business case doesn’t work at $558K, you need a different segment, a higher price, or a lower CAC before you commit budget.
Pro Tip: Pull search demand data (Google Keyword Planner, SEMrush) as a proxy for active buyer intent. If monthly search volume for your core problem is under 500 in your target geography, the TAM may be real but the market may not be actively shopping yet — a timing risk worth flagging.
How do you validate real demand before committing budget?
Secondary research tells you a market exists. Primary research tells you whether people will actually pay you to solve their problem. Those are very different questions, and skipping the second one is how teams end up building products for a market that “should” exist but doesn’t.
Building a precise buyer profile
Before you write a single interview question, define who you’re talking to. Map three things: the role (who signs the check vs. who uses the product), the job-to-be-done (what outcome they’re hiring a solution to achieve), and the buying moment (what triggers them to start looking). A buyer profile without a trigger is incomplete.
Interview question template (10–15 high-signal questions)
Run 10–20 interviews with target buyers. These questions consistently surface the highest-signal data:
- Walk me through the last time you dealt with [problem]. What happened?
- What did you try first? Why didn’t that work?
- How much time does this problem cost you per week?
- What would a perfect solution look like?
- Who else is involved in solving this problem on your team?
- Have you paid for a solution before? What did it cost?
- What would make you switch from your current approach?
- On a scale of 1–10, how urgent is solving this right now?
- What would you need to see to feel confident enough to buy?
- If this solution existed today at $X/month, what would your reaction be?
Listen for: unprompted price anchors, repeated objections, and the language buyers use to describe the problem (this feeds your positioning copy directly).
Survey questions to quantify priority and budget
For quantitative signal, run a 5–7 question survey to 50–150 people in your ICP. Include:
- “How often do you encounter [problem]?” (frequency)
- “How much does this problem cost your business per month, roughly?” (budget proxy)
- “Which of these solutions have you tried?” (competitive awareness)
- “What would you pay for a solution that fully solved this?” (WTP anchor)
Rapid validation experiments
Primary validation should include at least two lightweight experiments run in parallel:
- Demand signal test: A landing page or paid ad campaign that describes the solution and measures click-through and sign-up rates. Aim for a few percent conversion on cold traffic as a baseline signal.
- Concierge pilot: Manually deliver the solution to 3–5 customers and charge for it. This tests willingness-to-pay more directly than any survey.
- Message test: Run two ad variants with different positioning angles and measure which drives more qualified clicks.
- Pre-sell or LOI: Ask 5 prospects to sign a letter of intent or pay a deposit. Money is the only honest signal.
Success criteria checklist
You have enough signal to move to a pilot when:
- Several interviews confirm the problem is urgent
- Landing page conversion exceeds a baseline percentage on cold traffic
- Some concierge customers paid without heavy discounting
- Willingness-to-pay anchors from interviews show reasonable consistency around your target price
How do you find white space in a competitive market?
Most competitive analyses stop at a feature comparison table. That’s the wrong frame. The real question isn’t “who else does this?” It’s “what are buyers currently tolerating that they shouldn’t have to?”
Three-layer competitive map
Competition is broader than rival companies. Map all three layers:
- Direct competitors: Products or services that solve the same problem for the same buyer.
- Status-quo alternatives: What buyers do today instead of buying anything (spreadsheets, manual processes, internal teams, outsourced workflows).
- Structural substitutes: Adjacent solutions that partially solve the problem (a CRM that handles some of the workflow, a consultant who does it quarterly).
The status-quo layer is where most white space hides. If buyers are tolerating a spreadsheet-based process that takes 8 hours a week, that’s not a gap in the product market. It’s a gap in the distribution and positioning story.
Where to collect competitive evidence fast
You don’t need a six-week research project. Pull evidence from:
- Job ads: What skills are companies hiring for? This reveals internal capability gaps and tech stack clues.
- Customer reviews (G2, Capterra, Trustpilot): The 1- and 2-star reviews are a gold mine. They tell you exactly what incumbents fail to deliver.
- Win/loss CRM notes: Your own sales team’s notes on why deals were lost are the most underused competitive intelligence asset in most SMBs.
- Support tickets: Repeated support themes reveal product gaps competitors haven’t solved.
- Pricing pages: Pricing structure (per seat, per usage, flat fee) signals who a competitor is optimizing for.
For a structured approach to competitive mapping tailored to SMBs, the process of layering these sources into a coherent picture is faster than most teams expect.
Positioning canvas
A positioning statement has four elements: the buyer problem, your unique approach, the measurable value you deliver, and why you’re credible. Draft it as: “For [buyer] who [problem], [product] is the [category] that [unique approach] because [proof].”
Test for structural gaps by asking: Which subsegments are the incumbents ignoring? Which pain points appear in reviews but not in any product’s feature set? Which distribution channels are competitors not using? Those three questions, run against your competitive map, usually surface at least one defensible white space.
Pro Tip: Pull your last 90 days of sales call transcripts and support tickets into a simple spreadsheet. Group repeated phrases into clusters. The top three clusters by frequency are your most credible positioning anchors — and they’re already in your buyer’s language, not yours. Blue Prysm’s competitive intelligence tools can automate this clustering so you’re not doing it manually.
What unit economics do you need before you commit to a market?
“Underserved” often equals “unprofitable” once you run the math. Before you greenlight a pilot, you need a minimum viable economics check. Not a full financial model — just enough to know whether the business case holds at realistic scale.
The five metrics that matter
| Metric | What it measures | Why it matters for go/no-go |
|---|---|---|
| Revenue per customer (ACV) | Annual contract value per account | Sets the ceiling for CAC and the floor for margin |
| Gross margin % | Revenue minus direct delivery costs | Below 50% for SaaS or 30% for services, the model is fragile |
| CAC (Customer Acquisition Cost) | Total sales + marketing spend ÷ new customers | Must be recoverable within the payback window |
| LTV (Customer Lifetime Value) | ACV × gross margin × average retention years | LTV:CAC ratio below 3:1 signals a structural problem |
| Payback period | CAC ÷ (ACV × gross margin) | Over 18 months for an SMB is a red flag without strong retention data |
Sample unit economics: two scenarios
| Metric | Scenario A (Healthy) | Scenario B (Fragile) |
|---|---|---|
| ACV | $8,400 | — |
| LTV:CAC ratio | — | 1.5:1 |
Scenario B isn’t automatically a no-go. It’s a signal to redesign pricing, reduce CAC through channel changes, or improve retention before scaling. The early economics check is what prevents you from spending $200K on a GTM motion that can’t pay for itself.
Pricing experiments that protect your margin
- Pilot discount tied to data collection: Offer a 20% discount in exchange for weekly feedback sessions and usage data. You learn faster and justify the margin hit.
- Two-package test: Offer a core tier and a premium tier simultaneously. The ratio of uptake tells you where buyers anchor on value.
- Value-based pilot: Price against the outcome (e.g., “We charge 10% of the cost savings we generate”) rather than a flat fee. This works when the ROI is measurable and fast.
When your sensitivity analysis shows the economics only work under optimistic assumptions, that’s not a reason to stop. It’s a reason to escalate to a product or pricing redesign conversation before committing to a full launch.
How do you prioritize multiple opportunities without gut-feel bias?
When you have three or four candidate opportunities and limited resources, the scoring matrix is what keeps the decision defensible. Without it, the loudest voice in the room wins.
Scoring matrix template
Score each opportunity 1–5 on five dimensions, then apply weights:
| Dimension | Weight | What to assess |
|---|---|---|
| Market size (SOM) | — | Is the realistic Year 1 SOM above your minimum threshold? |
| Strategic fit | 20% | Does this align with your core capabilities and 3-year direction? |
| Validation signal | — | How strong is the primary research evidence (interviews, WTP, experiments)? |
| Unit economics | 20% | Does the LTV:CAC ratio exceed 3:1 at realistic assumptions? |
| Execution risk | 10% | Do you have the team, channel, and operational capacity to deliver? |
Sample scored example
| Dimension | Weight | Opportunity A | Opportunity B |
|---|---|---|---|
| Market size | — | 4 → 1.00 | 2 → 0.50 |
| Strategic fit | 20% | 5 → 1.00 | 4 → 0.80 |
| Validation signal | — | 3 → 0.75 | 5 → 1.25 |
| Unit economics | 20% | 4 → 0.80 | 3 → 0.60 |
| Execution risk | 10% | 3 → 0.30 | 4 → 0.40 |
| Weighted total | 3.85 | 3.55 |
Opportunity A scores higher, but Opportunity B has a stronger validation signal. That gap is worth a conversation before you commit.
Decision rules and governance
- Score ≥ 3.5: Proceed to pilot. Assign an owner, set a 90-day budget, and define the three metrics that will trigger a scale or stop decision.
- Score 2.5–3.4: Iterate. Identify the lowest-scoring dimension and run one more targeted validation experiment before re-scoring.
- Score < 2.5: No-go for now. Document the reasoning and set a 6-month review trigger.
Common scoring pitfalls to avoid
- Double-counting: Don’t score “market size” and “revenue potential” as separate dimensions — they measure the same thing.
- Optimistic priors: If your validation signal score is based on two interviews and a gut feeling, flag it as low-confidence and weight it accordingly.
- Ignoring capability fit: The PRIME framework (Product, Resource, Individual, Market, Economic) is a useful pre-screen for execution risk. A frequent root cause of failed market entries is ignoring whether the team actually has the skills and channels to win.
- Scoring by committee without a facilitator: Assign one person to own the final scores and document dissenting views separately.
What does a 90-day pilot roadmap actually look like?
A high score on the matrix means nothing without a concrete plan. Here’s how to turn a winning opportunity into a pilot your leadership team can approve in one meeting.
Sample 90-day roadmap
-
Days 1–30: Foundation
- Owner: Strategy Lead + Product
- Objectives: Finalize ICP, sign 3–5 pilot customers, configure delivery model
- Success criteria: Signed agreements, baseline metrics captured, onboarding complete
- Budget: Primarily internal time (est. 40–60 hours total)
-
Days 31–60: Execution and learning
- Owner: Product + Sales
- Objectives: Deliver the pilot, run weekly check-ins, capture usage and satisfaction data
- Success criteria: NPS ≥ 7, at least 2 customers report measurable outcome, CAC tracking active
- Budget: $5,000–$15,000 depending on delivery model and any paid acquisition
-
Days 61–90: Evaluate and decide
- Owner: Strategy Lead + CEO/Exec Sponsor
- Objectives: Analyze pilot data, re-run unit economics with real numbers, present scale/stop recommendation
- Success criteria: LTV:CAC ratio confirmed above 3:1, at least 2 customers willing to expand or refer
- Budget: $2,000–$5,000 for analysis, reporting, and stakeholder presentation
Deliverable checklist for the assessment package
- One-page recommendation memo (decision, top 3 assumptions, pilot plan summary)
- Assumptions log (every key number, its source, and its confidence level)
- Scoring sheet (completed matrix with evidence notes)
- Pilot plan (90-day roadmap with owners and budget)
Resourcing ballparks for SMBs
A full assessment typically requires a small cross-functional team with dedicated time and access to customer-facing staff for interviews. Total elapsed time varies, with additional direct costs for research tools and survey platforms common at SMB scale.
Markets shift, and a one-time assessment has a shelf life. Build in a monthly 60-minute review checkpoint to update assumptions as competitor positioning or buyer language changes.
How do you build a scoring model that executives can actually audit?
The difference between a scoring model that gets approved and one that gets questioned for three meetings is auditability. Every score needs a source, and every source needs to be traceable.
Evidence-backed scoring template
| Dimension | Score (1–5) | Evidence source | Confidence level | Last updated |
|---|---|---|---|---|
| Market size (SOM) | 4 | Bottom-up model, CRM pipeline data | High | [Date] |
| Strategic fit | 5 | Leadership alignment session notes | Medium | [Date] |
| Validation signal | 3 | 12 interviews, 1 landing page test | Medium | [Date] |
| Unit economics | 4 | Pilot pricing model, gross margin estimate | Medium | [Date] |
| Execution risk | 3 | PRIME capability check, team skills audit | Low | [Date] |
Operational checklist for running the scoring process
- [ ] All data inputs documented with source URLs or file references
- [ ] At least two reviewers have independently scored before reconciling
- [ ] Version number and date stamped on the scoring sheet
- [ ] Assumptions log updated within 48 hours of any new evidence
- [ ] Dissenting views captured in a separate notes field
- [ ] One-page recommendation memo drafted before the executive review
Interpreting scores and converting to action
A score is a starting point for a conversation, not a verdict. When two dimensions score below 3, the default is “iterate” regardless of the total. When execution risk scores below 2, escalate to a capability-building conversation before proceeding. Transparency about low-confidence scores builds more trust with executive reviewers than a polished deck with no uncertainty acknowledged.
Pro Tip: Blue Prysm’s Agentic AI at agentsente.blueprysm.com can cluster CRM call transcripts and support ticket data to generate segment-level evidence for your validation signal score. When you use AI-generated evidence in the scoring model, note it explicitly in the confidence field and link to the underlying data source. Auditability is what makes AI-assisted assessments credible to a board reviewer, not just faster for the analyst.
Key Takeaways
A structured market opportunity assessment workflow produces a defensible go/iterate/no-go decision and a 90-day pilot roadmap in 2–8 weeks, provided teams run primary validation and unit economics before committing budget.
| Point | Details |
|---|---|
| Frame before you research | Write your hypothesis and success criteria in Stage 1 so the assessment stays decision-focused throughout. |
| Use both sizing methods | Reconcile top-down and bottom-up SOM estimates; a large gap signals a flawed assumption worth investigating before presenting to leadership. |
| Primary research is non-negotiable | Run 10–20 interviews and at least two lightweight experiments (for example, a demand signal test and a concierge pilot) before scoring any opportunity. |
| Score with evidence, not instinct | Use a weighted matrix across five dimensions and document the source for every score so executives can audit the reasoning. |
| Blue Prysm keeps it live | Blue Prysm’s Agentic AI platform automates competitive monitoring, CRM synthesis, and scoring updates so the assessment stays current, not stale. |
The uncomfortable truth about market assessments most teams ignore
Most market opportunity assessments fail not because the market was wrong, but because the team was wrong for the market. That’s the uncomfortable finding that the PRIME framework surfaces when teams actually use it honestly: you can have a real market, a validated problem, and a credible SOM, and still lose because you don’t have the distribution channel, the technical capability, or the operational bandwidth to execute.
The habit most teams skip is the capability audit. They score market size and validation signal with rigor, then wave their hands at execution risk. “We’ll figure it out” is not a risk mitigation plan. It’s a deferred no-go decision that costs you six months and a pilot budget.
The second pitfall is confusing interest with willingness-to-pay. Buyers will tell you your idea is great in an interview. They will nod enthusiastically at a demo. They will not always give you a credit card number. The only validation that counts is money changing hands or a signed letter of intent. Everything else is market research theater.
The third habit that separates good assessments from great ones is the weekly assumption update. Markets move. A competitor launches. A buyer segment shifts. If your assessment was built in March and you’re making a go decision in June without updating the competitive layer, you’re flying on stale data. Treat the assessment as a living process, not a document you archive after the kickoff.
One more thing: stakeholder alignment on what “proof” looks like is a negotiation, not a presentation. Have that conversation in Stage 1, not Stage 7. When you define success criteria with your exec sponsor before the data comes in, you eliminate the most common approval delay: the goalpost move.
Blue Prysm cuts the time from hypothesis to decision
Running a full market opportunity assessment manually takes weeks of research, spreadsheet wrangling, and stakeholder chasing. Blue Prysm’s market research tools compress that timeline by automating the most time-intensive stages: real-time competitive monitoring, CRM synthesis, and scoring template population.
The platform maps directly to this workflow. The market analysis platform handles secondary research and living competitive briefs. The strategy library gives you 50+ frameworks including scoring matrices, positioning canvases, and 90-day roadmap templates you can adapt in minutes rather than build from scratch. Agentic AI at agentsente.blueprysm.com clusters your CRM transcripts and surfaces repeatable buyer objections, pricing anchors, and segment signals without a manual analysis sprint.
For SMB strategy teams that need to run assessments faster and keep them current without adding headcount, this is the practical alternative to a traditional consulting engagement. Start a trial or book a demo at blueprysm.com/market-research-tools and run your first scored opportunity through the workflow this week.
Useful sources and templates
- Market Opportunity Assessment: A Practical How-To Guide — Sprints & Sneakers: framework and living-process guidance
- Market Opportunity Analysis: A Step-by-Step Guide — workflow, sizing methods, and AI acceleration notes
- Evaluating an Opportunity — Duke Entrepreneurship Manual: competitive map and status-quo alternatives
- IDEA or PRIME Opportunity? — Journal of Small Business Strategy: capability-fit framework
- What Is a Market Analysis? — Hanover Research: monitoring and update cadence guidance
- How to Conduct a Market Analysis — American Marketing Association: 7-step process and best practices
- Market Analysis — Coursera: accessible overview with sales forecasting formula
- FREE SWOT Analysis Template — MOGHQ: downloadable template adaptable for competitive landscape and scoring checklist
- How AI Is Transforming SWOT Analysis — MOGHQ: AI-enabled strategic frameworks and real-time strategy tools
Blue Prysm templates and tools:
- Strategy Library Preview — 95+ frameworks including scoring matrices and roadmap templates
- Competitive Intelligence Software — automated competitor tracking for living assessments
- Market Insights Software — AI-powered customer language and market signal surfacing
FAQ
What are the core steps in a market opportunity assessment?
A market opportunity assessment typically moves through 5–7 stages: framing the decision, defining the segment, secondary research, primary validation, market sizing, competitive analysis, and prioritization with a pilot roadmap. The full process takes 2–8 weeks depending on scope and resource availability.
How do you evaluate a market opportunity objectively?
Use a weighted scoring matrix across five dimensions: market size (SOM), strategic fit, validation signal, unit economics, and execution risk. Score each 1–5, apply weights, and apply decision rules (≥ 3.5 = go, 2.5–3.4 = iterate, below 2.5 = no-go) so the decision is transparent and auditable rather than driven by whoever argues loudest.
What questions does a market opportunity assessment answer?
A well-run assessment answers six questions: Is the market large enough to matter? Who exactly is the buyer and what triggers their purchase? What are buyers currently tolerating (and paying) to solve this problem? Can we win against direct competitors and status-quo alternatives? Do the unit economics work at realistic scale? And do we have the capability to execute?
How many customer interviews do you need for validation?
Run 10–20 interviews with target buyers as a baseline for primary validation. Pair that with at least two lightweight experiments (for example, a demand signal test and a concierge pilot) to confirm willingness-to-pay beyond stated interest. Interest in an interview and money on the table are two very different signals.
How does Blue Prysm support a market opportunity assessment workflow?
Blue Prysm’s platform covers the research, competitive monitoring, scoring, and roadmapping stages of the workflow with real-time briefs, 50+ strategy templates, and Agentic AI that synthesizes CRM and call-transcript data into segment-level evidence. Teams using the platform can compress a manual 6-week assessment into a faster, continuously updated process without adding analyst headcount.