
TL;DR:
- Trend monitoring involves continuously tracking market, social, and competitor signals to inform decisions before opportunities or crises arise. It requires a small, defined keyword set, multi-source validation, and daily triage with a focus on relevance, not volume. Automated tools and AI assist in synthesizing signals into decision-ready briefs for faster strategic action.
Trend monitoring is the continuous, systematic tracking of market, technology, and consumer behavioral signals over time to give decision-makers earlier, evidence-based triggers for strategic action. Not quarterly. Not when a competitor surprises you. Continuously. According to QMarkets, the goal is to stop reacting to events after they occur and start building an intelligence foundation that informs decisions before the window closes.
Here is the bottom line: trend monitoring is not a research project. It is an operational habit.
TL;DR
- Trend monitoring = ongoing signal tracking (not one-off research)
- Primary benefits: earlier go/no-go signals, reduced strategic uncertainty, evidence for timing product and campaign bets
- Immediate next actions: define your trend territory (3–5 category keywords), pick two data sources, set a 15-minute daily triage habit
What is trend monitoring, and why does your strategy team need it?
Most strategy teams are flying on gut feeling and quarterly reports. By the time a trend shows up in an analyst deck, the early movers have already acted. Trend monitoring exists to close that gap.

The strategic value is concrete. When you track signals continuously, you can make faster go/no-go decisions on product bets, time campaigns to rising demand rather than trailing it, and catch early warning signals before a market shift becomes a crisis. A product team that spots a substantial week-over-week search volume spike in an adjacent category several weeks before a competitor launches has a real timing advantage. A campaign team that sees sentiment shifting on a core message before the campaign goes live can course-correct without burning budget.
Brandwatch’s trend analysis framework frames this precisely: the goal is not to predict the future with certainty but to connect shifts in online conversations and search volumes to specific business metrics, enabling smarter timing. That framing matters because it keeps monitoring grounded in commercial outcomes rather than interesting-but-irrelevant noise.
Three use cases where monitoring pays off immediately:
- Campaign timing: Rising search volume on a category keyword signals growing consumer intent. Launching before the peak captures cheaper CPCs and higher organic relevance.
- Product roadmap prioritization: Cross-source signal spikes (search + social + forum activity) on an unmet need validate a feature bet before you commit engineering resources.
- Crisis early warning: Sentiment shifts in customer forums or social listening feeds often precede public brand crises by days, giving communications teams time to prepare a response.
The importance of trend monitoring is not philosophical. It is about shortening the distance between a signal in the market and a decision in your organization.
How does trend monitoring differ from analysis, scouting, and forecasting?
These four terms get used interchangeably, and that confusion costs teams real money. They are distinct activities with different inputs, outputs, and timing.
- Trend scouting is discovery. You are scanning broadly for weak signals and emerging topics you did not know to look for. It is exploratory and often qualitative.
- Trend monitoring is ongoing observation. You already know which signals matter and you are tracking them continuously for changes in velocity, sentiment, or cross-source confirmation.
- Trend analysis uses historical patterns to identify what has already happened and project performance. It is retrospective by design. The AccountingTools definition describes it as plotting information from multiple time periods to spot actionable patterns, which is useful but inherently backward-looking.
- Trend forecasting takes analysis outputs and builds scenario projections. It answers “what might happen if this trend continues?”
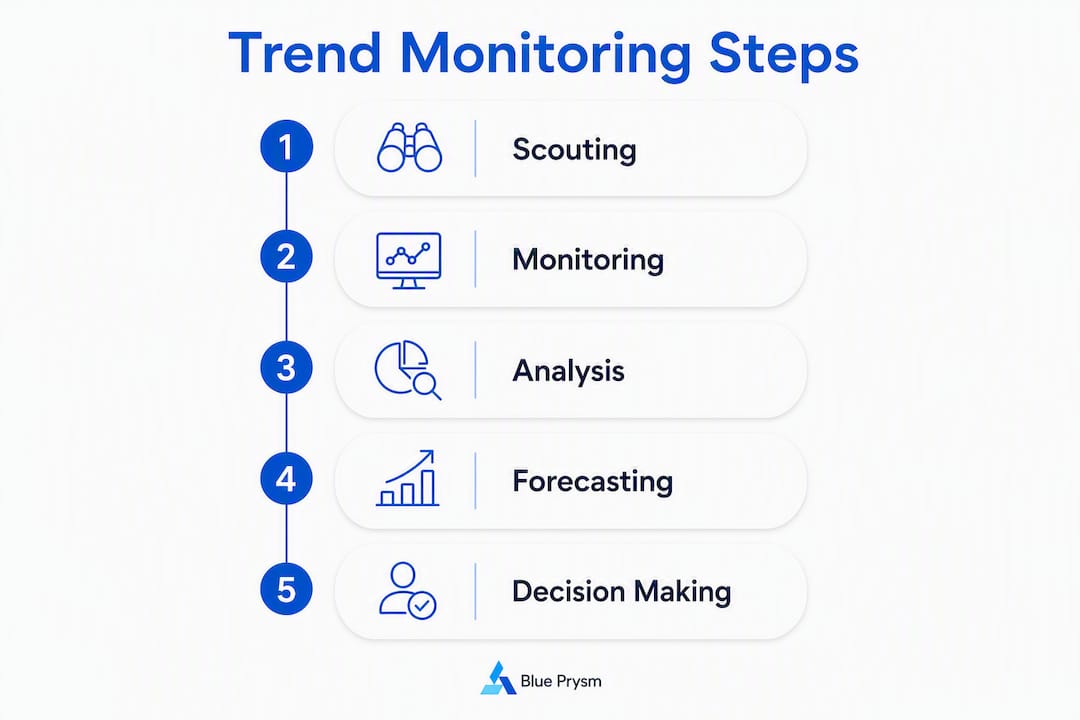
The cycle runs scouting → monitoring → analysis → forecasting, and each feeds the next. Scouting surfaces a new signal. Monitoring tracks whether it grows. Analysis confirms the pattern. Forecasting models the business implications.
The biggest organizational mistake is treating scouting and monitoring as separate functions owned by different teams. When discovery and tracking are siloed, signals get lost in the handoff.

Pro Tip: Set a formal scouting-to-monitoring handoff rule: any signal that appears in two independent sources during a scouting scan gets added to the active monitoring keyword set within 48 hours. This prevents interesting findings from dying in a slide deck.
What should your monitoring system actually track?
A monitoring system has six core components, and most teams skip at least three of them.
- Defined scope (trend territory): A bounded set of categories, topics, and keywords you are actively watching. Without this, you track everything and act on nothing.
- Data ingestion: Automated pulls from your chosen sources on a defined cadence.
- Signal scoring: A relevance filter that weights signals by commercial importance, not just volume.
- Alert routing: Signals above threshold get pushed to the right person in the right channel (usually Slack).
- Human review: A daily triage step where someone applies business judgment to filtered alerts.
- Trend repository: A living map of tracked trends, their status, and linked decisions.
The sources you pull from determine the quality of your signals. Here is how the main categories compare:
| Source category | What it reveals | Typical latency | Signal quality tradeoff |
|---|---|---|---|
| Search query trends (Google Trends, SEMrush) | Consumer intent, rising topics | 48–72 hours | High volume, needs context |
| Social listening (Twitter/X, Reddit, forums) | Sentiment, emerging narratives | Near real-time | Noisy; requires filtering |
| Platform-native indicators (TikTok Creative Center, YouTube Research) | Platform-specific virality | Real-time | Platform-specific; validate cross-source |
| Owned performance data (site analytics, CRM) | Actual customer behavior | 48–48 hours | High relevance, limited breadth |
| Competitor activity (launches, pricing, job postings) | Competitive intent | 1–7 days | Directional; needs interpretation |
| Investment and patent activity | Early-stage category bets | Weeks to months | Long lead time, high signal quality |
| Market reports and analyst notes | Macro category shifts | Monthly to quarterly | High credibility, low speed |
Platform-native indicators like TikTok Creative Center and YouTube Research, combined with social listening and owned performance data, help you validate whether a signal is platform-specific or a genuine market shift. That cross-source check is what separates a real trend from a one-platform spike.
For competitor monitoring and automated intelligence briefs, the job posting and product launch feeds are often the most underused. A competitor hiring ten ML engineers in a new vertical tells you something a press release never will.
Which monitoring techniques actually produce reliable signals?
The honest answer is that neither pure automation nor pure human judgment works alone. NetSuite’s guidance on trend analysis is direct: raw data extrapolation misleads; effective monitoring pairs automated intelligence with human-led assessment for business relevance.
Quantitative methods
- Search volume time-series anomaly detection: Flags statistically unusual spikes in keyword search volume. Works best with a 90-day baseline.
- Cross-source correlation: Checks whether a signal appearing in search also shows up in social and owned data. Correlation across sources is a strong confirmation signal.
- Velocity and acceleration metrics: Week-over-week growth rate tells you a trend is rising; the rate of change in that growth rate tells you whether it is accelerating or plateauing.
- Relevance scoring: Weights signals by proximity to your defined trend territory and commercial metrics.
Qualitative methods
- Forum and Reddit scans: Unstructured conversations surface language and pain points before they appear in search data. Low cost, high signal quality for early-stage discovery.
- Expert network interviews: Practitioners in adjacent fields often see category shifts 6–12 months before they appear in public data.
- Field interviews with customers: Direct conversations reveal behavioral shifts that no algorithm captures.
- Trend scouting reports: Structured summaries from a designated scout who reviews sources outside your normal monitoring stack.
AI-assisted technical approaches that improve lead time include time-series anomaly detection, natural language processing for semantic clustering, pattern recognition of trend “shapes,” and cross-source correlation. Hybrid models that combine these methods detect trends earlier than single-source tools.
Pro Tip: Start with three to five category-level keywords, not product-level ones. “Sustainable packaging” catches more early signal than “compostable mailer bags.” Broaden first, then narrow as signals confirm.
How do you build a trend monitoring program from scratch?
Seven steps. Do them in order.
- Define your objectives and trend territory. What decisions will this program inform? List them. Then map the category-level topics, adjacent markets, and behavioral signals that would change those decisions. This is your trend territory.
- Select 3–5 category-level keywords. Resist the urge to track 50 things. A small, well-chosen keyword set catches early signals without creating noise. You can expand later.
- Pick two to three sources and configure ingestion. Start with search query trends and one social listening source. Add owned data as a third. Do not add more until you have a working triage habit.
- Set scoring and alert thresholds. A significant week-over-week volume spike combined with cross-platform confirmation within a few days is a reasonable starting threshold for a high-priority alert. Adjust based on your category’s baseline volatility.
- Route alerts and run daily triage. Push alerts to Slack. Assign one person to spend 15 minutes each morning filtering alerts against commercial relevance. This is the habit that makes everything else work.
- Run a weekly synthesis and decision handoff. Every week, the monitoring owner produces a one-page brief: top three signals, their status, and a recommended action or watch. This brief goes into the strategy meeting.
- Iterate every 30 days. Review which alerts drove decisions and which were noise. Adjust thresholds and keyword sets accordingly.
Owner roles you need:
- Scouting lead: Runs discovery scans and hands off new signals to the monitoring set.
- Monitoring owner: Manages the keyword set, runs daily triage, and produces the weekly brief.
- Analyst: Applies quantitative methods to confirm or reject signals.
- Decision sponsor: The executive or director who receives the brief and owns the go/no-go call.
90-day milestones:
- Days 1–14: Trend territory defined, keyword set selected, two sources configured, Slack routing live.
- Days 15–45: Daily triage habit established, first weekly brief delivered, first threshold adjustment made.
- Days 46–90: First decision directly informed by a monitoring signal, program retrospective completed, keyword set refined.
Pro Tip: The weekly brief is more important than the daily alerts. Alerts catch signals. The brief forces synthesis. If your monitoring program produces alerts but no brief, you have a data feed, not an intelligence program.
What KPIs and alert thresholds should you actually use?
Vanity metrics are the enemy of good monitoring. Tracking raw mention volume without a relevance filter is how teams spend hours on signals that never touch a decision.
Here are the metrics that matter:
- Trend velocity: Week-over-week percentage change in signal volume for a tracked keyword. A sustained notable weekly increase over several consecutive weeks is a meaningful signal in most categories.
- Cross-source confirmation score: How many independent sources are showing the same signal simultaneously. A signal confirmed in three or more sources carries significantly more weight than a single-source spike.
- Sentiment shift: A directional change in the tone of conversations around a tracked topic. A 15-point negative sentiment shift on a brand keyword in 48 hours warrants immediate review.
- Share of voice on category keywords: Your brand’s presence in conversations about your category relative to the total. Declining share of voice is an early competitive warning.
- Competitor product-activity index: Frequency of competitor product mentions, job postings in key functions, and patent filings in your category over a rolling 30-day window.
Sample alert threshold rules include significant volume spikes on category keywords confirmed across multiple platforms within a few days, notable sentiment score changes over a short period on brand or product keywords, and noticeable increases in competitor product-activity indexes over a rolling monthly period.
The connection between search volume shifts and specific business metrics is what makes these thresholds meaningful. A volume spike without a business metric anchor is just noise with a number attached.
For a deeper walkthrough on how to analyze market trends once your monitoring program surfaces them, the analysis layer is where velocity data becomes a strategic recommendation.
How do you choose tools without getting sold a platform you don’t need?
Most SMBs overbuy on tooling and underbuild on process. The tool is not the program. The process is the program. Start lean.
Evaluation criteria that actually matter:
- Source coverage: Does it pull from the sources your category signals live in?
- Cross-source correlation: Can it confirm a signal across multiple sources, or does it show you one feed at a time?
- Real-time alerting: How fast does a signal trigger a notification?
- Slack integration: Can alerts route directly into your team’s active channels?
- Signal explainability: Does it show you why something is trending, or just that it is?
- Pricing fit: Is the cost proportional to the decisions it informs?
A lean starting stack for SMBs:
- Google Trends (free) for search volume baselines and category-level keyword tracking.
- A social listening tool with Reddit and forum coverage for qualitative signal capture.
- Your own site analytics and CRM data as the owned-performance layer.
- A shared Slack channel for alert routing and daily triage.
- A simple shared doc or Notion page as your trend repository.
Algorithmic discovery tools that scan large unstructured data sets and apply growth qualification filters can separate short-lived fads from sustainable trends, but they work best as a scouting layer on top of your monitoring stack, not as a replacement for it. Human review still improves business relevance.
When to scale to an integrated platform: when your monitoring program is producing weekly briefs that directly inform decisions, and the manual triage time exceeds two hours per week. At that point, the ROI on a platform that automates ingestion, scoring, and routing is clear. Examples of industry monitoring tools broken down by category and use case can help you evaluate what fits your stack before you commit.
What goes wrong, and how do you fix it?
Most monitoring programs fail quietly. They do not collapse; they just stop producing decisions. Here is why.
Common pitfalls:
- Treating monitoring as a one-off project. A trend audit is not a monitoring program. Monitoring requires a cadence, an owner, and a living keyword set.
- Single-source data. Relying only on Google Trends creates blind spots. Combining social listening, search trends, competitor activity, and owned data identifies signals earlier and with higher relevance.
- Tracking vanity metrics. Total mention volume without relevance scoring is noise. If a metric does not connect to a business decision, remove it.
- No owner, no cadence. A monitoring program without a named owner and a fixed weekly rhythm will drift into irrelevance within 60 days.
- Alert fatigue. Too many alerts, too low a threshold, and the team stops reading them. A 15-minute daily triage habit with a commercial relevance filter is the antidote.
Red flags that your program has gone low-signal:
- The weekly brief has not changed in three weeks.
- No alert has triggered a decision in the last month.
- The monitoring owner cannot name the top three active signals without checking a dashboard.
Governance fixes:
- Assign a named monitoring owner with a defined time budget (30–60 minutes per week minimum).
- Review and prune the keyword set monthly.
- Require that every strategy meeting agenda include a standing “signals update” item.
- Score every alert for relevance before routing it. Unscored alerts are just noise with a Slack notification.
Pro Tip: If your team is experiencing alert fatigue, do not raise the threshold first. Audit the keyword set first. Most fatigue comes from tracking too many product-level keywords instead of category-level ones. Narrow the set, then adjust thresholds.
How does an AI-enabled platform turn monitoring signals into decisions?
The workflow that works looks like this: multi-source ingestion → trend scoring → daily triage in Slack → weekly strategy brief → roadmap or campaign action. Each step has a clear owner and a defined output.
Here is what the platform layer needs to do well for this to work:
- Cross-source correlation: Automatically confirm whether a signal appears across search, social, and owned data before surfacing it.
- Trend scoring: Assign a relevance score based on proximity to your trend territory and commercial metrics, not just raw volume.
- Alert routing: Push scored alerts to Slack with enough context (source, velocity, sentiment direction) that the triage owner can make a call in under two minutes.
- Signal explainability: Show the analyst why a signal scored the way it did. Black-box scoring creates distrust and slows adoption.
- Strategy library integration: Connect confirmed trends directly to frameworks and playbooks so the decision handoff is a template, not a blank page.
Blue Prysm’s market analysis platform is built around this workflow. Real-time ingestion, trend scoring, and Slack routing are table-stakes features. The differentiator for SMBs is the strategy library integration: when a confirmed trend surfaces, the platform connects it to relevant frameworks and roadmap templates so the decision sponsor gets a brief with a recommended action, not just a data point.
Pro Tip: The Agentic AI layer at agentsente.blueprysm.com is where the synthesis step gets automated. Instead of a human writing the weekly brief from scratch, the agent aggregates scored signals, applies strategy frameworks, and drafts the brief for human review. The monitoring owner’s job shifts from data wrangling to judgment.
Key Takeaways
Trend monitoring works when it is continuous, multi-source, owned by a named person, and connected directly to a decision cadence — not treated as a research project.
| Point | Details |
|---|---|
| Monitoring is an operational habit | Continuous signal tracking, not a quarterly research project, is what produces earlier strategic decisions. |
| Multi-source confirmation matters | Combining search, social, and owned data identifies signals earlier and with higher relevance than any single source. |
| Start with 3–5 keywords | A small, category-level keyword set with a 15-minute daily triage habit outperforms a 50-keyword dashboard with no owner. |
| Alert thresholds need business anchors | A 30% week-over-week volume spike confirmed across two platforms in 72 hours is a concrete, actionable threshold example. |
| Blue Prysm automates the synthesis step | Blue Prysm’s platform connects scored trend signals to strategy frameworks and roadmap templates, turning monitoring outputs into decision-ready briefs. |
The part most guides won’t tell you about trend monitoring
There is a version of trend monitoring that feels productive but produces nothing. You have seen it: a shared dashboard with 40 tracked keywords, a Slack channel full of unread alerts, and a strategy team that has quietly stopped checking it. The program exists. It just does not work.
The reason is almost never the tools. It is the synthesis gap. Data comes in. Nobody writes the brief. The strategy meeting happens without the signals. Repeat for 90 days and the program is effectively dead, even though the subscription is still running.
What actually works is boring and unglamorous: a named owner, a small keyword set, a 15-minute daily habit, and a one-page weekly brief that lands in the strategy meeting agenda. That is it. The tools are secondary.
Where Agentic AI genuinely changes the equation for SMBs is not in the ingestion layer. It is in the synthesis layer. Most small strategy teams do not have a dedicated analyst to turn monitoring data into a brief. An agentic workflow that aggregates scored signals, applies a relevant framework, and drafts the brief for human review closes that gap without adding headcount. The human judgment stays in the loop; the grunt work gets automated.
The starter metrics I would recommend to any strategy team building from scratch: trend velocity (week-over-week %), cross-source confirmation score, and sentiment direction on your top three category keywords. Those three, tracked consistently, will tell you more than a 20-metric dashboard reviewed once a month.
One personal lesson: the teams that get the most value from monitoring are the ones that treat the weekly brief as a non-negotiable agenda item, not an optional pre-read. When the brief has a standing slot in the strategy meeting, signals get acted on. When it is an email attachment, it gets skimmed and forgotten.
Blue Prysm gives your team a faster path from signal to strategy
Most SMB strategy teams are one person short of a real monitoring program. They have the intent, the data sources, and the tools. What they are missing is the synthesis layer: the step that turns a scored signal into a decision-ready brief with a framework attached.
Blue Prysm closes that gap. Real-time market ingestion, cross-source trend scoring, and Slack alert routing are built in. The strategy library with 50+ frameworks connects directly to confirmed signals, so when a trend surfaces, your team gets a brief with a recommended playbook, not just a data point to interpret from scratch.
The Agentic AI layer at agentsente.blueprysm.com automates the weekly synthesis step that most teams skip because they do not have the bandwidth. Your monitoring owner reviews and approves; the agent does the drafting. That is a materially different outcome than a dashboard that produces alerts nobody acts on.
If your strategy team is ready to move from interesting data to faster decisions, explore Blue Prysm’s market research tools and request a demo. The trial path is designed for teams that want to see the signal-to-decision workflow before committing.
Useful sources for practitioners
- Trend Monitoring: A Practical Guide for Innovation Teams (QMarkets) — Covers the full monitoring lifecycle, daily triage habits, and governance structure for innovation teams.
- How to Use AI for Real-Time Trend Detection (TrendlyAI) — Technical walkthrough of AI-assisted detection methods including anomaly detection, NLP clustering, and hybrid model design.
- Trend Analysis (Brandwatch Social Media Glossary) — Concise definition of trend analysis with a focus on connecting social signals to business metrics.
- Trend Analysis Definition and Usage (AccountingTools) — Clear explanation of trend analysis as a historical pattern tool, useful for distinguishing it from monitoring.
- Trend Analysis (NetSuite) — Business strategy framing of trend analysis with guidance on pairing automation with human review.
- How to Monitor Industry Trends for Your Startup Without an Enterprise Budget (MentionDrop) — Practical lean-stack guide for SMBs covering forums, Reddit, Slack routing, and weekly review cadence.
- How to Monitor Industry Trends: 9 Efficient Methods (Exploding Topics) — Covers algorithmic discovery methods and how to separate fads from sustainable trends.
- How to Find Social Media Trends: 5 Methods That Work (Social Insider) — Explains platform-native indicators and cross-platform validation techniques.
- Market Analysis Platform: Real-Time Insights for Strategy Teams (Blue Prysm) — Blue Prysm’s platform overview covering real-time ingestion, trend scoring, and decision workflow integration.
- The Role of AI in Competitor Monitoring: 2026 Guide (Blue Prysm Blog) — Practical guide to AI-assisted competitor signal extraction and monitoring stack design.
FAQ
What does trend monitoring include?
Trend monitoring includes continuous tracking of market signals across search queries, social conversations, competitor activity, owned performance data, and macro category indicators, filtered through relevance scoring and routed to decision-makers on a defined cadence.
What is an example of trend monitoring in practice?
A product team tracking a 30% week-over-week search volume spike on a category keyword, confirmed across social and forum sources within 72 hours, then routing that signal to a strategy brief that informs a roadmap prioritization decision, is a complete trend monitoring cycle.
How is trend monitoring different from trend analysis?
Trend monitoring is forward-looking and continuous, tracking live signals as they emerge. Trend analysis is retrospective, using historical data to identify patterns and project performance. Monitoring feeds analysis; analysis informs forecasting.
What is Trendalytics used for?
Trendalytics is a retail-focused trend intelligence platform that uses search, social, and sales data to help merchandising and product teams identify emerging consumer demand signals before they peak. It is one category of specialized monitoring tool designed for consumer goods and fashion verticals.
How do you avoid alert fatigue in a monitoring program?
Keep the tracked keyword set small (3–5 category-level keywords), apply a commercial relevance score before routing any alert, and run a 15-minute daily triage to filter signals against business priorities rather than letting every alert reach the full team.