
The fastest path from question to decision-ready insight is a six-step process: define the business decision, frame your research questions, pick your method mix, recruit the right respondents, collect and clean the data, then analyze and act. Before you open a survey tool or pull a Census table, lock in three things first:
- Define the decision you are trying to make (pricing, launch market, feature priority).
- Set a minimum sample that fits your method (8–20 interviews for qualitative discovery; 100+ responses for quantitative validation).
- Assign a deadline so the study feeds a real planning milestone, not a shelf report.
That’s the whole game. Everything below is how to run each step without wasting money, collecting garbage data, or ending up with findings nobody uses.
What does a six-step market research process actually look like?
Good market research is not a one-off survey you send when you’re nervous about a launch. It’s a repeatable workflow that produces a decision at the end of every cycle. Here’s how each step works in practice.

Step 1: Write a one-page research brief
Before you pick a tool or write a single question, write down the business decision this study must inform. A brief that ties every question to a decision is the single highest-leverage artifact for keeping studies on track. One page is enough: state the decision, the hypotheses you’re testing, the audience, and the deadline. If you can’t explain the decision in two sentences, the study isn’t ready to start.
Step 2: Choose your method mix
Primary or secondary? Qualitative or quantitative? The answer depends on where you are in the decision cycle. Secondary data (Census, BLS, industry reports) is almost always the right starting point because it’s free and fast. Qualitative interviews come next to stress-test your hypotheses. Quantitative surveys close the loop with statistical confidence. Skipping straight to a 500-person survey before you’ve done five interviews is one of the most expensive mistakes founders make.

Step 3: Design instruments and sampling
Write questions that map to a specific decision, not to general curiosity. Screen respondents before they enter the study. Define your sample plan with demographic quotas and behavioral criteria (for example, purchasers in the last six months within a specific income band).
Step 4: Recruit and collect
Schedule interviews in clusters so you can adjust the discussion guide mid-study. For surveys, use attention checks and completion-time filters to catch disengaged respondents. Bot contamination is a real data-quality risk on open panels; screener logic and minimum completion times are your first line of defense.
Step 5: Analyze and synthesize
Convert patterns into insight statements: a concise claim, the evidence behind it, and a linked recommendation. “Sixty percent of respondents said delivery speed matters more than price, which means our GTM messaging should lead with fulfillment, not cost” is an insight statement. “Most people care about delivery” is not.
Step 6: Implement and monitor
Research that doesn’t change a decision is a sunk cost. Assign each insight statement an owner, a deadline, and a success metric. Then schedule a 90-day check-in to see whether the assumption held. Markets move; a static report from eight months ago is often worse than no report at all.
On timelines: DIY secondary research takes one to three days. A qualitative interview series (8–12 interviews) typically runs two to four weeks including recruiting. A full quantitative survey with a paid panel can close in one to two weeks. An agency-led study with qual and quant phases usually runs six to twelve weeks. Build your research deadline backward from your planning milestone, not forward from your curiosity.
Pro Tip: Time-box every study. Set a hard “analysis complete” date before you start collecting. Studies without deadlines expand to fill whatever time is available and rarely produce decisions.
Which research method fits your question?
The trap most entrepreneurs fall into is picking a method because it feels familiar, not because it fits the question. Here’s a clean framework for matching method to goal.
Primary vs. secondary research
Primary research is data you collect yourself: surveys, interviews, focus groups, observational studies. It’s specific to your audience and your question, but it costs time and money. Secondary research is data someone else already collected: government statistics, industry reports, academic studies, published surveys. It’s faster and cheaper, but it may not match your exact segment.
The best-practice sequence is secondary first to frame hypotheses, qualitative next to generate and pressure-test them, and quantitative last to validate at scale. Reversing that order wastes budget.
Qualitative vs. quantitative
| Goal | Method | When to use it | Example |
|---|---|---|---|
| Explore a new problem | Qualitative (interviews, focus groups) | Early stage; you don’t know what you don’t know | Feature discovery for a new product |
| Generate hypotheses | Qualitative + secondary data | Pre-survey; you need language and themes | Pricing sensitivity exploration |
| Validate at scale | Quantitative (survey, A/B test) | You have a hypothesis and need statistical confidence | Confirming willingness to pay across segments |
| Benchmark performance | Quantitative + secondary | Ongoing; you need a comparable baseline | NPS vs. industry average |
| Measure market size | Secondary + quantitative | Sizing TAM/SAM/SOM for a business plan or pitch | Census + survey-based share estimates |
Mixed-method sequencing in practice
A product team validating a new feature would run it like this:
- Pull Census ACS data and BLS employment figures to size the addressable population.
- Conduct 10–15 discovery interviews to surface the real jobs-to-be-done and the language customers use.
- Build a survey using those exact phrases (not internal jargon) and send it to a panel of 200+ qualified respondents.
- Use the survey results to prioritize features and set a price range.
The 4 Ps (product, price, place, promotion) are a useful checklist for making sure your research questions cover the full decision space, not just the feature you’re already excited about.
Where do you find reliable U.S. market data for free?
The best market research tips for budget-conscious founders start here: most of the data you need to size a U.S. market and frame a competitive hypothesis is free. You just need to know where to look.
Core public sources
- U.S. Census Bureau: American Community Survey (ACS) tables give you demographic breakdowns by ZIP code, county, and metro area. Use the Census Business Builder for industry-level data. Query pattern: filter by NAICS code + geography + year range.
- Bureau of Labor Statistics (BLS): Employment and wage data by occupation, industry, and county. Useful for estimating workforce size in a target segment and benchmarking compensation.
- U.S. Small Business Administration (SBA): The SBA recommends evaluating six dimensions in every market study: demand, market size, economic indicators, location, market saturation, and current price points. Their resource list points directly to the federal data series that answer each question.
- Data.gov: Aggregates datasets from dozens of federal agencies. Useful for niche industries where a single agency (FDA, USDA, DOT) holds the relevant data.
- Google Trends: Short-term interest signals and geographic breakdowns. Run a five-year comparison of two competing search terms to see which category is growing. It won’t give you revenue figures, but it will tell you whether attention is moving toward or away from your category.
- Pew Research Center: Nationally representative surveys on consumer attitudes, technology adoption, and social trends. Particularly useful for B2C founders trying to understand behavioral shifts before they show up in purchase data.
Paid sources worth knowing
- Statista: Aggregates third-party market reports and survey data into a single interface. Useful for quick market-size estimates and industry benchmarks when you need a number fast and can’t wait for a custom study.
- IBISWorld: Industry-level revenue, growth rate, and competitive concentration data for U.S. markets. A single industry report gives you the five-year revenue trend, major players, and cost structure benchmarks that would take weeks to assemble from public sources.
Triangulating public data with your own analytics
Public data tells you about the market. Your own analytics tell you about your slice of it. Combine them: use Census population figures to estimate your Total Addressable Market, then divide your current customer count by that figure to calculate your penetration rate. If your conversion funnel shows a drop-off at a specific step, a short qualitative study can explain why. Trend analysis that layers public signals on top of internal metrics gives you a much sharper picture than either source alone.
Pro Tip: When pulling Census ACS data, always check the margin of error column. For small geographies (ZIP codes, rural counties), the MOE can be larger than the estimate itself, which makes the figure unreliable for business planning.
How do you design surveys and interviews that produce trustworthy data?
The quality of your findings is determined before you collect a single response. Instrument design is where most small-business research goes wrong, and it’s also where the fixes are cheapest.
Question-writing rules
- Map every question to a decision. If you can’t name the decision a question informs, cut it.
- Use neutral wording. “How satisfied are you?” beats “How much do you love our product?”
- Balance closed and open questions. Closed questions (Likert scales, multiple choice) give you counts; open questions give you language and context.
- Avoid double-barreled questions. “How easy and affordable was the process?” is two questions. Split them.
- Put demographic questions at the end, not the beginning. Starting with age and income increases drop-off.
Sample survey items
- On a scale of 1–5, how difficult is it to [specific task] today? (closed, measures pain intensity)
- What’s the main reason you chose [category] over alternatives? (open, surfaces real purchase drivers)
- In the last 12 months, how many times did you [behavior]? (closed, measures frequency)
- What would have to be true for you to switch providers? (open, reveals switching barriers)
Sampling rules of thumb
For qualitative discovery, thematic saturation typically appears between 8 and 20 interviews in B2B contexts. Past 20, you’re mostly hearing the same themes again. For quantitative surveys, a sample of 100 gives you a margin of error around ±10% at 95% confidence; 400 respondents brings that down to ±5%. For segmentation analysis, you need enough respondents in each segment to run cross-tabs, which usually means 50+ per cell.
Combine demographic quotas with behavioral screening to keep your sample both representative and relevant. A survey about B2B software purchasing decisions sent to anyone with a business email is not a sample; it’s noise. Screen for decision-making authority, company size, and recent purchase behavior before anyone sees question one.
Incentives and ethics
Cash equivalents such as gift cards or PayPal tend to yield better response quality than sweepstakes entries in many B2B studies. Modest incentives for short surveys improve professional respondent engagement. Always disclose how data will be used, anonymize responses before sharing internally, and never use survey data to target respondents with sales outreach without explicit consent.
Quality controls
- Screener logic: Route out respondents who don’t meet your criteria before they enter the main survey.
- Attention checks: Include one or two questions with an obvious correct answer (“Select ‘Strongly Agree’ to confirm you’re paying attention”).
- Completion-time filters: Flag responses completed in under half the median time as potentially low quality.
- Bot contamination detection: Use honeypot fields (hidden questions a human would skip) and IP deduplication on open panels.
Data quality is the foundation that everything else rests on. A perfectly designed analysis on contaminated data produces confident wrong answers.
How do you map competitors and find white space in your market?
Competitive analysis is not a spreadsheet of feature checkboxes. The goal is to find the gap between what customers need and what existing options actually deliver.
A simple competitive mapping framework
Start by mapping who competes for your customer’s attention and budget, not just who sells a similar product. A project management tool competes with email, spreadsheets, and “we’ll figure it out in the meeting.” That’s the real competitive set. Use this framework:
- Direct competitors: Same product, same customer, same job-to-be-done.
- Indirect competitors: Different product, same customer, same budget line.
- Status quo: Whatever the customer does today if they don’t buy anything.
The SBA’s competitive analysis guidance recommends assessing market share, strengths and weaknesses, barriers to entry, and the importance of your target segment to each competitor. That last point is underrated: a competitor who treats your target segment as a secondary market is far easier to displace than one who has built their entire product around it.
Metrics to collect for each competitor
- Pricing tiers and packaging (public pricing pages, G2, Capterra)
- Feature coverage relative to the jobs-to-be-done you identified in qualitative research
- Distribution channels (direct sales, self-serve, resellers, marketplaces)
- Customer reviews and recurring complaints (a goldmine for positioning)
- Estimated market share signals (traffic tools, app store rankings, LinkedIn headcount growth)
Estimating saturation and finding underserved segments
High saturation doesn’t mean no opportunity. It means the opportunity is in a segment the incumbents are ignoring or serving poorly. Look for clusters of negative reviews that describe the same unmet need. Look for segments (by company size, geography, industry vertical) where the leading players have thin coverage. That’s your white space.
For a repeatable benchmarking template, step-by-step competitor benchmarking gives you a structured approach you can run quarterly without starting from scratch each time.
How do you analyze results and size your market opportunity?
Raw data doesn’t make decisions. Insight statements do. Here’s how to get from a spreadsheet of survey responses to a defensible market opportunity.
Segmentation best practices
Don’t segment by demographics alone. Behavioral and attitudinal segments (heavy users vs. occasional users, price-sensitive vs. quality-driven) are usually more predictive of purchase behavior than age and income. Validate a segment by checking that it’s measurable (you can count it), accessible (you can reach it), and substantial (it’s large enough to matter to your unit economics).
For qualitative data, use thematic coding: cluster responses by theme, count how many respondents mentioned each theme, and pair representative quotes with those counts. “Twelve of fifteen interviewees described onboarding as the primary friction point” is a defensible finding. “Several people mentioned onboarding” is not.
TAM/SAM/SOM: a worked example
| Market Level | Definition | Example Calculation | Result |
|---|---|---|---|
| TAM (Total Addressable Market) | Everyone who could theoretically buy | 5M U.S. small businesses × $500 avg annual spend | — |
| SAM (Serviceable Addressable Market) | Segment you can realistically reach | 500K businesses in your target vertical and size band | — |
| SOM (Serviceable Obtainable Market) | Realistic share in years 1–3 | 1% of SAM in year one | — |
Use Census and BLS data to anchor the TAM figure. Use your qualitative research to define the SAM criteria (which verticals, which company sizes, which geographies). Use competitive analysis to estimate a realistic SOM based on your go-to-market capacity.
Statistical basics
A margin of error of ±5% at 95% confidence requires roughly 400 respondents from a large population. For smaller populations (under 10,000), you need a higher proportion of the total. Cross-tabs (comparing responses across two variables, like segment × satisfaction score) require at least 50 respondents per cell to be meaningful. If a cell has fewer than 30, treat the finding as directional, not conclusive.
Pro Tip: Before you present findings to a leadership team or investor, run a simple bias check: did your recruiting method systematically over-represent a particular type of respondent? A survey promoted only in your existing customer community will skew toward satisfied users and undercount the people who left or never converted.
How do you turn research findings into a business plan and GTM strategy?
Findings that sit in a slide deck don’t move a business forward. The goal is three concrete decisions with owners and deadlines.
The three-decisions template
Use this format for every major finding:
- Decision: What choice does this finding inform? (e.g., pricing tier structure)
- Evidence: What did the data show? (e.g., 68% of respondents said they’d pay more for same-day delivery)
- Next action: What changes, who owns it, and by when? (e.g., add a premium tier with expedited fulfillment; product lead owns by Q3)
Run every insight statement through this template before the debrief meeting. If a finding doesn’t map to a decision, it’s interesting but not urgent.
Integrating findings into a roadmap
Research findings have a shelf life. Pricing data from 18 months ago may not reflect current willingness to pay. Build a 90-day review cycle into your planning calendar: at each cycle, check whether the assumptions your roadmap rests on still hold, and trigger a micro-study if a key metric has shifted significantly.
What to outsource vs. do internally
- DIY: Secondary research, Google Trends analysis, competitive pricing scans, short customer pulse surveys (under 10 questions, existing customer list).
- Platform-assisted: Quantitative surveys with panels (SurveyMonkey/Momentive, Qualtrics), AI-moderated interviews, automated competitive monitoring.
- Freelance or agency: Full qualitative studies (recruiting, moderation, analysis), segmentation studies, conjoint pricing analysis, ethnographic research.
The decision rule is simple: outsource when the method requires expertise you don’t have or when the stakes of a bad study are higher than the cost of a good one.
What tools and templates actually speed up research execution?
The right tool for a $500 DIY study is not the right tool for a $50,000 agency engagement. Match the tool to the budget and the method.
Tool categories
- Survey platforms: SurveyMonkey/Momentive and Qualtrics are the two most widely used options for U.S. small businesses. SurveyMonkey is faster to set up for simple studies; Qualtrics offers more sophisticated logic and panel access for complex segmentation work. HubSpot also offers survey tools integrated with its CRM, which is useful when you want to tie responses directly to contact records.
- AI transcription and analysis: Tools like Otter.ai and Rev handle interview transcription. For thematic coding at scale, AI-assisted analysis can surface patterns across dozens of transcripts in hours rather than days.
- Recruitment panels: Respondent.io and User Interviews are strong options for B2B qualitative recruiting. For quantitative panels, SurveyMonkey Audience and Qualtrics panels give you access to screened U.S. respondents.
- Analytics dashboards: Google Analytics 4 for web behavior, Mixpanel or Amplitude for product analytics. These are your behavioral data sources; pair them with survey data to triangulate self-reported attitudes against actual behavior.
- Competitive intelligence: Automated monitoring tools track competitor pricing, messaging, and product changes continuously. Blue Prysm’s competitive intelligence platform delivers automated briefings so you’re not manually checking competitor sites every week.
Templates to download first
- Research brief template: One page; decision, hypotheses, audience, timeline, success criteria.
- Discussion guide template: Opening, warm-up, core questions mapped to hypotheses, closing.
- Screener template: Qualifying criteria, disqualifying criteria, quota targets.
- Survey template: Intro, screener, core questions (closed + open), demographics, thank-you.
The Blue Prysm strategy library includes 50+ frameworks and templates that cover research planning, competitive analysis, and GTM strategy, so you’re not building instruments from scratch every time.
What does market research actually cost, and how long does it take?
Budget and timeline are the two questions founders ask most often and get the least honest answers to. Here’s a realistic picture.
| Approach | Typical Cost Range | Time to Insight | What You Get |
|---|---|---|---|
| DIY (public data + your own list) | — | 1–5 days | Secondary data, basic survey, limited sample |
| Platform-assisted (survey tool + panel) | — | 1–2 weeks | Quantitative survey with screened panel, basic analytics |
| Freelance researcher | — | 3–6 weeks | Qual or quant study with professional moderation and analysis |
| Full-service agency | — | 6–12 weeks | Multi-method study, full report, strategic recommendations |
DIY works for pulse checks and hypothesis generation. Platform-assisted research is the sweet spot for most small businesses running a pricing or feature validation study. Freelance researchers make sense when you need qualitative depth but can’t justify agency fees. Agency engagements are worth the cost when the decision is large (a new market entry, a major product pivot) and the cost of a wrong call exceeds the research budget.
The upgrade trigger for a paid panel is simple: when your existing customer list is too small to produce statistically meaningful results, or when you need respondents who haven’t already bought from you.
How do you make market research a continuous strategic asset?
One-off studies answer one question. Continuous research programs answer the questions you haven’t thought to ask yet. The shift from project to program is where Agentic AI changes the economics entirely.
The operational checklist for recurring research
- Set automated triggers: A 10% drop in conversion rate, a spike in competitor search volume, or a shift in NPS should automatically flag a micro-study. Don’t wait for a quarterly review to notice a market signal.
- Schedule micro-studies: A 10-question pulse survey to a panel of 50 qualified respondents takes two to three days and costs a fraction of a full study. Run one every six to eight weeks on your highest-uncertainty assumptions.
- Synthesize in under two weeks: Findings that take a month to reach a decision-maker are often stale by the time they arrive. Build a short-cycle synthesis process: raw data in, insight statements out, within 10 business days.
- Feed roadmaps directly: Every insight statement should map to a roadmap item, a pricing assumption, or a GTM hypothesis. If it doesn’t, it goes in the archive, not the deck.
Integrating public data, internal analytics, and AI-synthesized signals
The most defensible market intelligence combines three layers:
- Public data layer: Census demographics, BLS employment trends, SBA market indicators. These update on a schedule and give you the macro context.
- Internal analytics layer: Your own conversion data, churn signals, product usage patterns. This is the most specific data you have and the most underused.
- AI-synthesized signals layer: Automated monitoring of competitor moves, news, and social signals, synthesized into a weekly briefing. Industry monitoring tools that pull from multiple sources and surface pattern changes are the fastest way to stay ahead of a market shift without hiring a full-time analyst.
AI is most valuable when it’s embedded across the research lifecycle: speeding collection through AI-moderated interviews, accelerating thematic coding, and surfacing patterns across large datasets. But as Qualtrics notes, AI amplifies the quality of your inputs. A well-designed study with clear objectives produces sharp AI-synthesized insights. A poorly designed one produces confident noise.
The analytics skills required to operationalize this kind of continuous program are increasingly in demand. If your team doesn’t have them internally, a platform that automates the synthesis layer is a faster path than hiring.
Continuous monitoring in practice
A founder running a B2B SaaS product noticed through automated competitive monitoring that two competitors had quietly dropped their entry-level pricing within the same quarter. Without a continuous monitoring trigger, that signal would have surfaced in a quarterly review, six weeks after the market had already started repricing. With it, the team ran a 48-hour pricing pulse survey, confirmed that their own customers were aware of the competitive shift, and adjusted their packaging before the next sales cycle. That’s the difference between research as a project and research as an operating system.
Key Takeaways
The most effective market research process starts with a one-page brief that ties every question to a decision, sequences secondary data before qualitative work before quantitative surveys, and closes the loop by assigning each insight an owner and a deadline.
| Point | Details |
|---|---|
| Start with a research brief | A one-page brief linking every question to a decision keeps studies on track and findings used. |
| Sequence your methods | Run secondary research first, then qualitative interviews (8–20 for B2B), then quantitative surveys to validate. |
| Use free U.S. data sources | Census Bureau, BLS, SBA, and Google Trends answer most market-sizing and trend questions at no cost. |
| Control data quality | Screener logic, attention checks, and completion-time filters prevent bot contamination and low-quality responses. |
| Blue Prysm for continuous intelligence | Blue Prysm’s platform automates competitive monitoring, synthesizes signals, and feeds findings directly into strategy roadmaps. |
The mistake most entrepreneurs make with market research
Most founders treat market research as a confidence ritual rather than a decision tool. They run a survey after they’ve already decided what to build, write questions that confirm what they already believe, and recruit respondents from their existing network (who are predisposed to be supportive). The result is a study that feels rigorous but produces exactly the answer they were hoping for. That’s confirmation bias with a spreadsheet attached.
The second most common mistake is wrong sample. Surveying your existing customers to understand why prospects don’t convert is like asking people who already married you why they said yes. You need the people who said no. That means recruiting outside your current user base, which is uncomfortable and more expensive, but it’s the only way to get honest signal about acquisition barriers.
Leading questions are the third trap. “How much would you value a feature that saves you two hours per week?” is not a neutral question. It anchors the respondent to a benefit you’ve already framed. A better version: “Walk me through how you handle [task] today” followed by “What’s the most frustrating part of that process?” Let the respondent name the problem before you offer the solution.
The fix for all three is the same: write your research brief before you write your questions, and have someone outside the founding team review the instrument for leading language before you send it. One outside read catches most of the bias.
Research becomes a habit when it’s tied to a planning calendar, not a launch panic. Schedule a quarterly micro-study on your highest-uncertainty assumption. It takes two days and costs less than a single bad hire.
Real-time market intelligence without the agency price tag
Most small strategy teams are stuck choosing between expensive agency studies and DIY surveys that don’t scale. Blue Prysm is built for the gap between those two options: an AI-powered platform that delivers real-time market analysis, automated competitive briefings, and a library of 50+ strategy frameworks so your team spends time on decisions, not data collection.
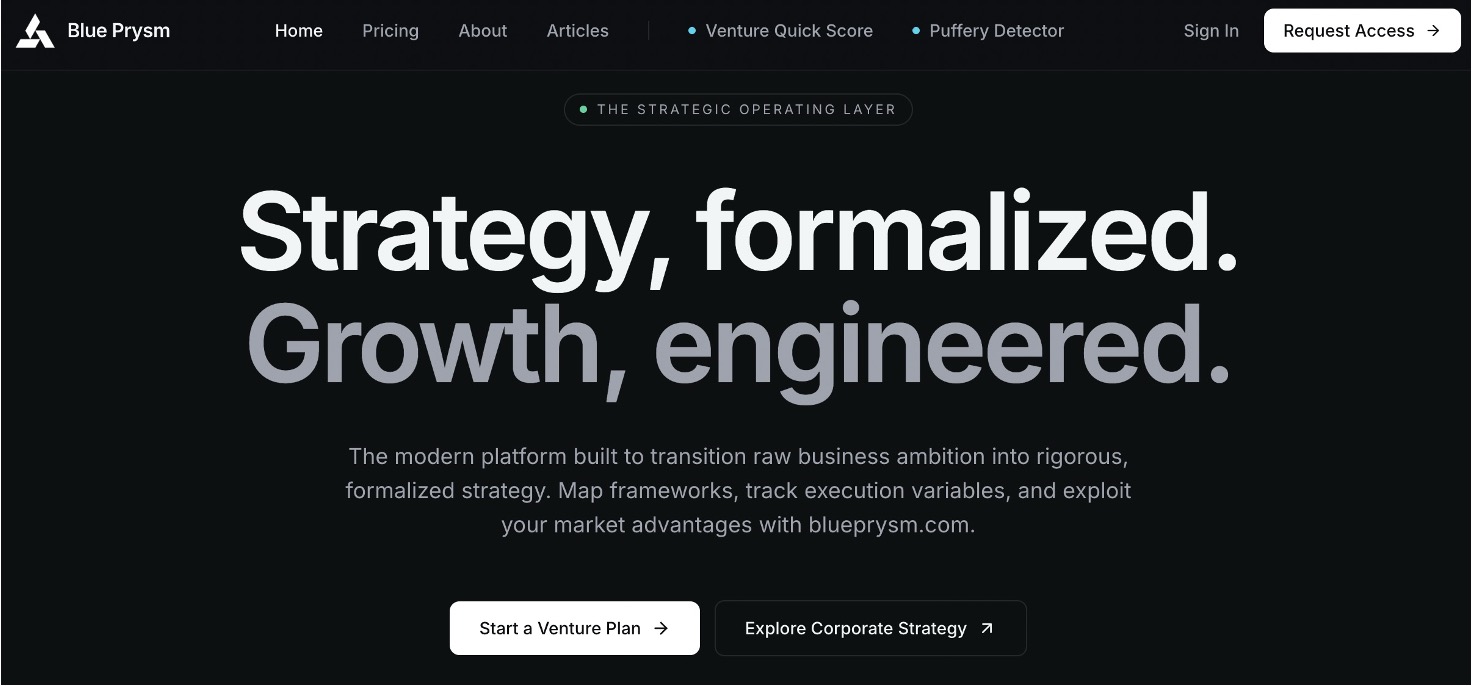
Where a traditional research engagement takes six to twelve weeks and a five-figure budget, Blue Prysm’s market research tools give you continuous monitoring, AI-synthesized signals, and integrated templates that feed directly into your roadmap. The platform’s Agentic AI workflows handle the synthesis layer automatically: tracking competitor moves, flagging market shifts, and surfacing insight statements your team can act on the same week. You get the depth of a research program without the overhead of running one manually.
If your next strategic decision depends on market data you don’t have yet, the Blue Prysm platform is where to start. Explore the platform and see how fast a small team can move when the research layer runs itself.
Useful sources and further reading
The sources below are the primary references behind this guide. Each one is worth bookmarking for ongoing research work.
- U.S. Small Business Administration: Market Research and Competitive Analysis: The SBA’s practical guide covers the six core research dimensions (demand, size, economic indicators, location, saturation, pricing) and links directly to the federal data series that answer each one. Start here before you open any paid tool.
- U.S. Census Bureau Data Tools: The Census Business Builder and American Community Survey tables are the most useful starting points for demographic and geographic market sizing. Filter by NAICS code and geography; always check the margin of error column for small-area estimates.
- Bureau of Labor Statistics: Demographics: Employment, wage, and occupation data by industry and geography. Use the Occupational Employment and Wage Statistics (OEWS) series for compensation benchmarking and the Local Area Unemployment Statistics (LAUS) for regional economic context.
- Qualtrics: Market Research Guide: One of the most thorough practitioner guides available. Particularly strong on method selection, instrument design, and the secondary-to-qualitative-to-quantitative sequencing logic.
- HubSpot: How to Do Market Research: Covers the buyer’s journey framing and how to integrate research into a CRM-driven GTM strategy. Useful for B2C and B2B founders who want to connect research findings to marketing execution.
- Koji: How to Conduct Market Research Step-by-Step: Strong on the operational details of running a study: brief writing, instrument design, qualitative saturation thresholds, and insight statement formatting.
- Pew Research Center: Nationally representative survey data on consumer attitudes, technology adoption, and demographic trends. Free to access; useful for B2C founders benchmarking behavioral shifts.
- Statista and IBISWorld: Both require subscriptions for full access. Statista is better for quick market-size estimates across a wide range of industries; IBISWorld is stronger for U.S. industry-level revenue trends, competitive concentration, and cost structure benchmarks.
FAQ
What are the 4 Ps of market research?
The 4 Ps (product, price, place, promotion) are a planning framework from the marketing mix, not a market research methodology. In research practice, they function as a checklist for making sure your study covers the full decision space: what to offer, what to charge, where to sell, and how to message it.
What are the 5 Ps of market research?
The 5 Ps extend the original 4 Ps by adding “people” (or sometimes “process” or “positioning,” depending on the framework version). In market research, the fifth P is a prompt to include customer and team dynamics in your study design, not just product and pricing questions.
What is the rule of seven in marketing research?
The rule of seven is a marketing heuristic suggesting a prospect needs to encounter your message roughly seven times before taking action. In research terms, it’s useful for designing messaging tests and frequency experiments, but it’s a guideline, not a statistical law. Use it to frame hypotheses about campaign exposure, then validate with actual conversion data.
How many interviews do you need for qualitative B2B research?
Thematic saturation in B2B qualitative studies typically appears between 8 and 20 interviews. Past that threshold, new themes rarely emerge and additional interviews produce diminishing returns for the cost of recruiting and analysis.
Can you do effective market research on a small budget?
Yes. Start with free U.S. public data (Census Bureau, BLS, SBA, Google Trends) to size the market and frame hypotheses. Run 8–12 discovery interviews with your target segment using a simple screener and a modest incentive such as a gift card. Use a platform like SurveyMonkey to validate findings with a 100+ person survey. This approach can produce decision-ready insight with relatively low total cost.