
TL;DR:
- Most marketers struggle to prove ROI from social media data, despite collecting large amounts of information.
- Focusing on buying-signal metrics and tiered measurement cycles improves the connection between social performance and business outcomes.
Social media and analytics is the systematic collection and interpretation of data from social platforms to inform marketing decisions and prove business impact. Most marketing professionals collect plenty of data. The real problem, confirmed by 55% of social media marketers, is proving ROI from that data. That gap between data volume and business clarity is exactly what this guide addresses. We will walk through the metrics that actually matter, the tools worth your time, and the reporting frameworks that turn raw numbers into decisions your leadership team will act on.
What is social media analytics and why does it matter?
Social media analytics is the practice of collecting, measuring, and interpreting data from owned, earned, and paid social channels to drive evidence-based business decisions, not gut calls. The industry term you will see in enterprise settings is “social performance analysis,” but the concept is the same regardless of what you call it.

Analytics tells you the why behind your data. Reporting packages that story for stakeholders. Analytics uncovers context; reporting communicates it. Treating them as the same thing is one of the most common mistakes marketing teams make, and it leads to dashboards full of numbers that nobody acts on.
The business case is straightforward. When you know which content drives website visits, which campaigns generate leads, and which audiences convert, you stop spending budget on what feels good and start spending it on what works.
Which key social media metrics matter most and why?
Most teams over-focus on vanity metrics like likes and follower counts. Those numbers feel good in a weekly report. They do not predict revenue.
The metrics worth tracking fall into two categories: vanity metrics and buying-signal metrics.
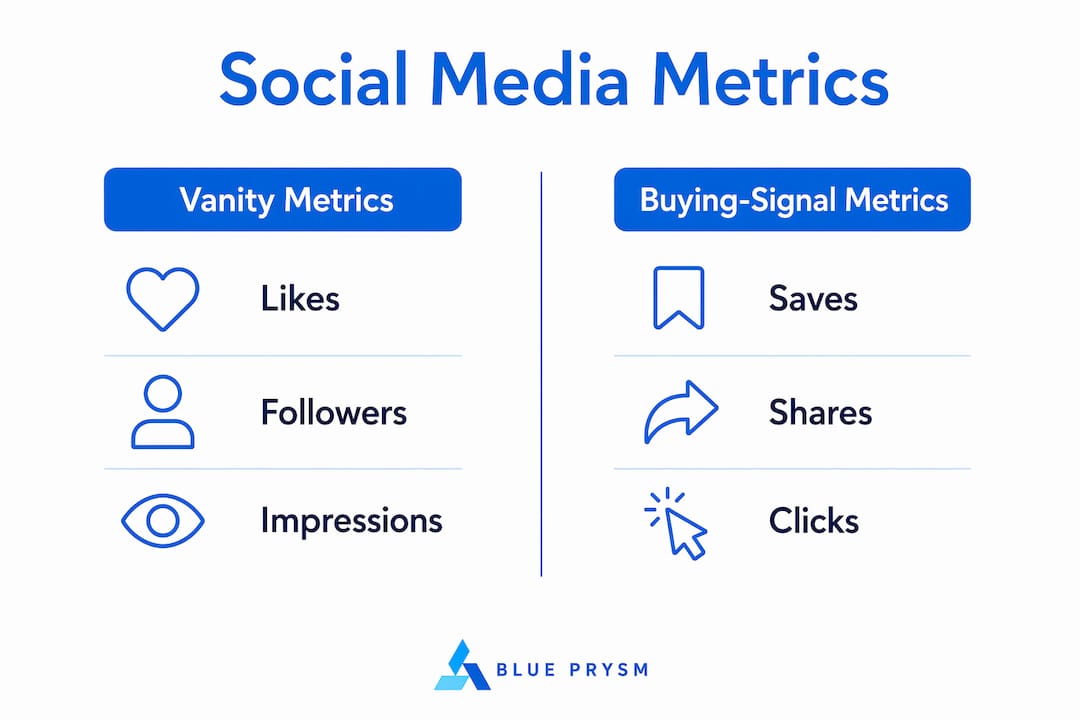
| Metric type | Examples | Business impact |
|---|---|---|
| Vanity metrics | Likes, follower count, impressions | Measures reach and visibility only |
| Buying-signal metrics | Saves, shares, clicks, DMs | Predicts purchase intent and revenue |
| Engagement metrics | Engagement rate by reach, comments | Measures content resonance with actual viewers |
| Conversion metrics | Link clicks, form fills, sales | Directly ties social activity to business outcomes |
Engagement rate by reach is a far more honest metric than raw engagement. It tells you what percentage of people who actually saw your content chose to interact with it. A post with 10,000 impressions and 500 engagements is performing better than one with 50,000 impressions and 600 engagements.
The saves-to-reach ratio is one of the most underused signals in social media performance analysis. An ideal saves-to-reach ratio on Instagram sits between 1% and 5%. A high saves rate tells you the content has longevity. People are bookmarking it to return to later, which signals genuine value rather than passive scrolling.
Pro Tip: Before your next content review, pull your saves and shares data separately from your likes. If your saves-to-reach ratio is below 1%, your content is being seen but not valued enough to keep. That is the real signal to act on.
How do analytics tools for social media improve strategy and reporting?
Native platform analytics provide solid basic tracking. They are free, built in, and sufficient for teams managing a single channel. The moment you operate across two or more platforms, native tools become a liability. You end up manually reconciling data from separate dashboards, which wastes time and introduces errors.
Third-party tools solve this by consolidating cross-platform data into a single view. The best ones add competitor benchmarking, automated reporting, and historical trend analysis. Here is what to look for when evaluating any analytics platform:
- Cross-channel consolidation: One dashboard for all platforms, not five separate logins
- Competitor benchmarking: The ability to measure your performance against industry peers, not just your own past results
- Automated reporting: Scheduled reports delivered to stakeholders without manual effort
- CRM and web integration: Connecting social data to website traffic and customer records for a full picture of the customer path
That last point is where most teams leave value on the table. Social data in isolation tells you what happened on the platform. Social data connected to your CRM and Google Analytics tells you what happened to the customer afterward. That connection is what turns social media insights into revenue attribution.
Pro Tip: Connect your social analytics platform to your web analytics and CRM before your next quarterly review. Even a basic UTM tagging system on all social links gives you the data to show leadership exactly which posts drove pipeline.
What measurement frameworks should teams use for social media analytics?
Measurement cadence is the part of data analytics for social media that most teams get wrong. They either check metrics daily (which creates noise) or quarterly (which misses operational problems). The right answer is a tiered measurement cycle: monthly, quarterly, and annually.
Here is how each cycle should work in practice:
- Monthly reviews cover operational metrics: engagement rate, reach, follower growth, and content performance by format. The goal is to catch what is working and what is not before you waste another month’s budget.
- Quarterly reviews cover strategic metrics: audience growth trends, campaign ROI, conversion rates, and channel mix. This is where you make decisions about budget reallocation and content strategy shifts.
- Annual reviews cover major decisions: channel investment, team structure, technology stack, and brand positioning. These reviews require 9–12 months of data to be meaningful.
One insight that changes how you think about monthly reporting: social content compounds. A post published in week one of the month may still be generating saves and shares in week four. Short reporting windows, like weekly snapshots, systematically undercount content performance. A 30-day minimum window gives you a far more accurate read.
Each monthly report should include reach and engagement by content type, top-performing posts with a note on why they worked, conversion data tied to specific campaigns, and one clear recommendation for the next month. That last element is what separates a report from an analysis.
How do social listening and sentiment analysis complement analytics?
Social analytics measures what happens with your content. Social listening reveals what is being said about your brand, industry, and competitors beyond your own posts. These are two different data sets, and you need both.
Here is the practical difference:
- Analytics answers: How did our last campaign perform? What content drove the most clicks?
- Social listening answers: What are people saying about our brand right now? What problems are customers complaining about publicly?
- Sentiment analysis answers: Is the overall tone of those conversations positive, negative, or neutral?
“Serious marketing teams integrate social listening with analytics to get a whole-picture view of brand perception and performance. Without listening data, you are only measuring what you created. With it, you are measuring what the market actually thinks.”
The combination matters most in two scenarios: crisis management and trend detection. When a negative story breaks, listening tools catch the spike in brand mentions minutes after it starts. Standard batch analytics might not surface that signal until your next scheduled report. Advanced teams build near real-time data pipelines that detect sentiment spikes within minutes, giving them time to respond before a conversation becomes a crisis.
Pro Tip: Set up keyword alerts for your brand name, your top product names, and your CEO’s name. Check them weekly at minimum. You will catch problems and opportunities that your owned-channel analytics will never show you.
Key Takeaways
The most effective social media analytics practice combines buying-signal metrics, tiered measurement cycles, and integrated listening data to connect social performance directly to business outcomes.
| Point | Details |
|---|---|
| Focus on buying signals | Track saves, shares, clicks, and DMs instead of likes and follower counts. |
| Use tiered measurement cycles | Review operational metrics monthly, strategic metrics quarterly, and major decisions annually. |
| Connect social to CRM and web data | UTM tagging and CRM integration turn social data into revenue attribution. |
| Integrate social listening | Listening data reveals brand perception beyond your owned content. |
| Saves-to-reach ratio matters | An Instagram saves-to-reach ratio of 1–5% signals content with genuine longevity. |
The metric trap I see marketing teams fall into every time
I have reviewed social media reports from marketing teams across a wide range of industries, and the pattern is almost always the same. The dashboard is full of numbers. Impressions, reach, follower growth, post frequency. It looks thorough. It is almost entirely useless for making a business decision.
The trap is not laziness. It is that vanity metrics are easy to pull and easy to present. They go up most months, which makes everyone feel good. But when a CFO asks what social media contributed to pipeline last quarter, that dashboard has no answer.
The shift I recommend is simple but uncomfortable. Before you build your next report, ask: “If this number doubled, would we make a different business decision?” If the answer is no, cut it. Follower count doubling rarely changes a budget decision. Conversion rate doubling always does.
The other thing I have learned is that AI-powered tools are genuinely changing what is possible for smaller teams. Platforms like Blue Prysm now give marketing professionals access to real-time market intelligence that used to require a dedicated research team. The gap between what a five-person marketing team can know and what a fifty-person team can know is closing fast. That is worth paying attention to.
— Colin Bowdery
How Blue Prysm supports smarter social media decisions
Marketing professionals who want to move beyond basic platform dashboards need tools that connect social performance to broader market context.
Blue Prysm’s market research tools pull together social signals, competitor activity, and market trends into a single AI-powered workspace. Instead of switching between five platforms to build a quarterly report, you get consolidated intelligence that is ready to present. The competitive intelligence software tracks competitor social activity automatically, so you always know how your performance compares to the market, not just to your own past results. For marketing teams and business leaders who need to make faster, better-informed decisions without adding headcount, Blue Prysm closes that gap directly.
FAQ
What is social media analytics?
Social media analytics is the process of collecting and interpreting data from social platforms to measure performance and guide marketing strategy. It covers owned, earned, and paid social data to support evidence-based decisions.
What social media metrics should I prioritize?
Prioritize buying-signal metrics like saves, shares, website clicks, and conversions over vanity metrics like likes and follower counts. These signals have a direct connection to revenue and purchase intent.
How often should I review social media performance data?
Use a tiered cadence: monthly for operational metrics, quarterly for strategic decisions, and annually for major channel or budget decisions. Reviewing data too frequently creates noise; too infrequently misses problems early.
What is the difference between social analytics and social listening?
Social analytics measures performance on your own content. Social listening tracks what is being said about your brand across the entire platform, including conversations you did not start or participate in.
How do I prove ROI from social media?
Connect your social analytics to web analytics and your CRM using UTM parameters on every social link. That connection lets you trace which posts and campaigns drove traffic, leads, and sales.