
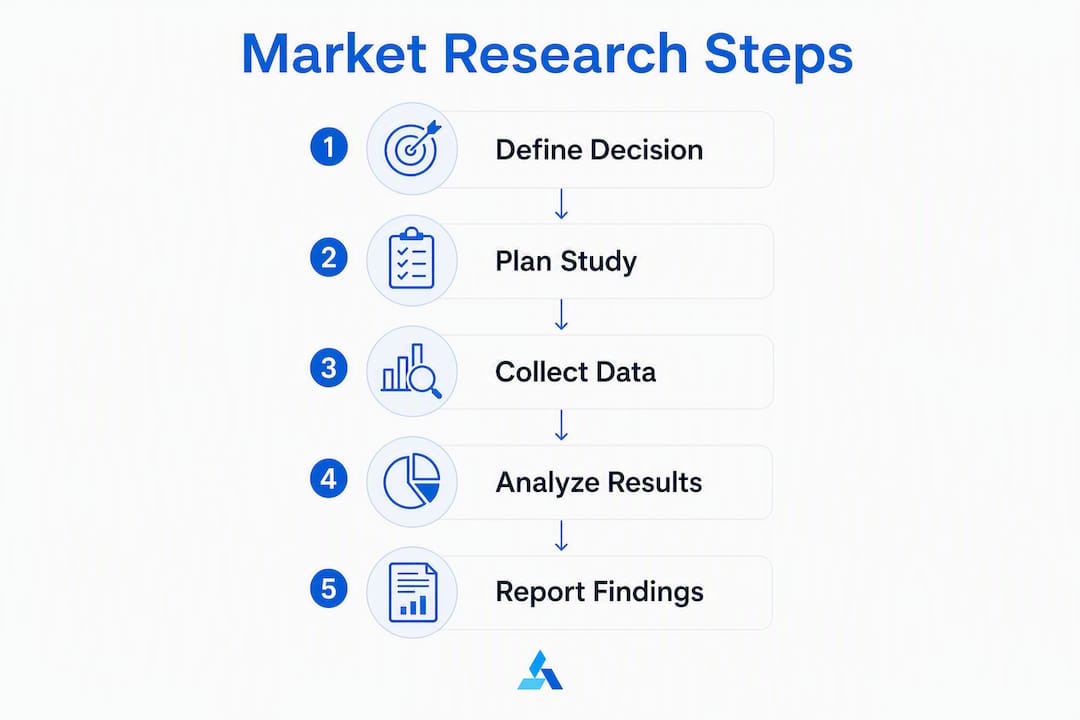
Run this step-by-step market research checklist to convert a business decision into validated data you can act on. The process follows six repeatable stages: define the decision, plan your methods, collect data, analyze findings, report recommendations, and institutionalize learning. Here is what to expect before you start:
- Step 1: Write a one-sentence decision statement and convert it into 3–5 specific research questions.
- Step 2: Choose your methods, define your sample, set milestones, and estimate your budget.
- Step 3: Run secondary research first, then qualitative discovery, then quantitative validation.
- Step 4: Clean, describe, cross-tabulate, and synthesize your data into insight statements.
- Step 5: Package findings into a report with clear recommendations, owners, and KPIs.
- Step 6: Set a research cadence so findings feed future decisions, not just this one.
Timeline at a glance: A small study (one method, one audience segment) takes roughly one to two weeks. A medium study (mixed methods, a modest number of interviews plus a survey) runs several weeks. A large study with multiple segments and statistical validation can take up to several months.
Cost range: DIY with free tools runs at minimal cost. A mixed-method study using a panel and basic software typically costs a few thousand dollars. Vendor-assisted or agency-run studies start at a higher price point and can cost significantly more.

Your single next action: write the business decision you are trying to make, then draft the three to five questions whose answers would change what you do. Everything else flows from that.

What is market research, and which type should you use?
Market research is a repeatable process for answering business decisions using a combination of secondary data (existing sources) and primary data (information you collect yourself). The U.S. Small Business Administration frames it plainly: research helps you find customers and reduce risk before you commit resources. That framing matters. Research is not a box to check before launch. It is a risk-reduction tool you use whenever a decision is expensive enough to get wrong.
The first choice you face is qualitative versus quantitative. They answer different questions, and confusing them is one of the most common reasons studies produce data that nobody uses.
| Dimension | Qualitative | Quantitative |
|---|---|---|
| Core question | Why and how? | How many and how much? |
| Typical sample size | 8–20 participants | 100–several hundred respondents |
| Output | Themes, language, hypotheses | Percentages, distributions, significance |
| Best for | Feature discovery, positioning, messaging | Pricing validation, market sizing, segmentation |
| Common methods | In-depth interviews, focus groups, ethnography | Online surveys, behavioral analytics, A/B tests |
Qualitative work generates hypotheses. Quantitative work tests them. Using a very large survey to discover what problem customers have is inefficient because the tool is not appropriate for exploratory questions. Conversely, making a pricing decision based on 12 interviews is a gut call dressed up as research.
Pro Tip: Mix methods whenever the decision is high-stakes. Run 10–15 interviews to surface the real language customers use, then build a survey around those exact phrases. The qualitative pass sharpens your survey questions; the quantitative pass tells you how widely the themes hold.
Step 1: Define the decision and write your research questions
The most common reason market research fails is not bad data. It is a vague objective. “Learn more about our customers” is not a research objective. It is a wish. Practitioners consistently find that studies anchored to 3–5 specific, testable business questions produce findings teams actually use, while studies built around broad curiosity produce slide decks nobody reads twice.
Start with a one-sentence decision statement: “We will [do X] if research shows [condition Y].” For example: “We will launch the premium tier at $79/month if research shows that more than 40% of current users would pay above $60 for the three features they rate highest.” That sentence tells you exactly what data you need, at what threshold, and for which audience.
From that decision statement, write 3–5 research questions:
- Pricing: What price points do target customers consider fair, expensive, and out-of-reach for this category?
- Launch readiness: What is the unaided awareness of our brand among the target segment in our top three markets?
- Feature prioritization: Which three features drive the most willingness to pay among users who have tried the product at least twice?
- Audience sizing: How large is the addressable segment of small-business owners in the U.S. who currently pay for a comparable solution?
- Positioning: What language do customers use to describe the problem we solve, unprompted?
Before you move to methods, align with your stakeholders on two things: who signs off on the findings, and what a “good enough” answer looks like. If your CEO will only act on findings from a sample of 200 or more, build that into your plan now. If a directional answer from 15 interviews is sufficient to greenlight a pilot, you just saved six weeks and several thousand dollars.
Step 2: Build a research plan that you can actually execute
Choose the minimal set of methods that will answer each research question. More methods mean more cost, more time, and more analysis. Add a method only when a simpler approach cannot answer the question with acceptable confidence.
Method selection
| Method | Best for | Pros | Cons | Typical sample |
|---|---|---|---|---|
| In-depth interviews | Discovery, messaging, feature needs | Rich context, unexpected insights | Time-intensive, hard to scale | 8–20 |
| Online surveys | Validation, sizing, segmentation | Fast, scalable, quantifiable | Shallow if questions are poorly designed | 100–500+ |
| Behavioral analytics | Usage patterns, funnel drop-off | Objective, no recall bias | Tells you what, not why | All users |
| Secondary research | Market sizing, competitive context | Free or low-cost, fast | May be outdated or mismatched to your segment | N/A |
| Observational studies | UX, workflow, in-context behavior | Reveals unspoken needs | Expensive, hard to recruit | 5–10 sessions |
Timeline milestones
| Study size | Recruit | Field | Analysis | Report |
|---|---|---|---|---|
| Small (1 method) | Days 1–3 | Days 4–6 | Days 8–10 | Day 11–13 |
| Medium (mixed methods) | Week 1 | Weeks 2–3 | Week 4 | Week 5–6 |
| Large (multi-segment) | Weeks 1–2 | Weeks 3–6 | Weeks 7–8 | Weeks 10–12 |
Budget line items
Estimate your costs across four categories: your own time (at your hourly rate), participant incentives ($25–$150 per interview depending on audience seniority), software (survey tools, transcription, analysis platforms), and any external analysis or moderation. A 15-interview qualitative study with participant incentives, transcription software, and analysis time typically costs several thousand dollars in total.
Sampling basics: For surveys, aim for a sample that reflects your actual customer population by key variables (industry, company size, role, geography). For interviews, recruit for diversity of perspective, not just availability. A screener with three to five qualifying questions prevents you from interviewing the same profile twelve times. Early-stage product research consistently shows that recruiting the wrong participants is more damaging than having a small sample.
Step 3: Collect data without wasting weeks on logistics
Follow this sequence: secondary research first, qualitative discovery second, quantitative validation third. Secondary research is fast and cheap and should frame your primary questions before you spend a dollar on recruiting. Starting with a survey before you understand the problem space is how teams end up with 400 responses that answer the wrong question.
Secondary research checklist
- U.S. Census Bureau for demographic and geographic data
- Bureau of Labor Statistics (BLS) for employment, wage, and industry data
- Bureau of Economic Analysis (BEA) for GDP, consumer spending, and sector trends
- U.S. Department of Commerce for trade and industry reports
- Industry association reports and trade publications
- Your own CRM, analytics, and support ticket data
- Competitor reviews on G2, Capterra, or Amazon (depending on category)
Stop secondary research when you have a clear picture of market size, key competitors, and the language customers use publicly. That last point matters more than most teams realize. The most valuable text in competitor-review mining is customers’ exact phrasing about frustrations and desired outcomes. Those phrases belong in your survey questions and your positioning copy, not paraphrased into corporate language.
Sample survey questions by objective
Awareness: “Before today, had you heard of [brand/category]?” (Yes / No / Unsure)
Preference: “Rank the following features from most to least important when choosing a [product type].” (Ranked list)
Pricing: “At what monthly price would [product] start to feel expensive but still worth it? At what price would it feel too expensive to consider?”
Satisfaction: “On a scale of 0–10, how likely are you to recommend [product] to a colleague? What is the main reason for your score?”
Interview guide template
Opening (2 min): “Tell me about your role and how you typically handle [problem area].”
Core probes (20–30 min):
- “Walk me through the last time you dealt with [problem]. What triggered it?”
- “What did you try first? What worked, what didn’t?”
- “If you could change one thing about how you currently handle this, what would it be?”
Closing (5 min): “Is there anything about this topic we haven’t covered that you think is important?” / “Who else on your team deals with this?”
Qualitative discovery generally saturates after several interviews. Fewer than eight risks missing important themes. Beyond twenty, without changing your guide or audience segment, you are mostly hearing repetition.
Pro Tip: To cut no-shows by roughly half, send a calendar confirmation with a one-sentence reminder of the incentive and a direct dial-in link 24 hours before each interview. Offer a 15-minute reschedule window rather than canceling outright.
AI-moderated interviews and automated transcription can collapse a two-week fieldwork phase into two to three days for teams running structured interview guides. The tradeoff is depth of probing: AI moderation works well for structured discovery but misses the unscripted follow-up that surfaces the most useful insight. Use automation for volume; use human moderators for nuance.
Step 4: Analyze data and turn raw responses into insight
Analysis is where most teams either rush or stall. Rushing produces surface-level takeaways (“customers want it to be easier to use”). Stalling produces a 60-slide deck that nobody reads. The goal is a short set of evidence-backed insight statements that directly answer your research questions.
Work through this sequence:
- Clean: Remove incomplete responses, flag outliers, and check for straight-lining in surveys (respondents who selected the same answer for every question).
- Describe: Run frequency distributions and basic descriptive statistics (mean, median, range) for each quantitative variable.
- Cross-tabulate: Break results by key segments (role, company size, tenure, usage frequency) to find where responses diverge.
- Test: For any claim that drives a major decision, check whether the difference between groups is large enough to be meaningful given your sample size. Small samples amplify noise.
- Synthesize: For qualitative data, code transcripts by theme, count theme frequency across participants, and note which themes appeared across multiple segments.
Example analysis output table
| Research question | Key finding | Segment where it’s strongest | Confidence |
|---|---|---|---|
| What price feels fair? | $49–$69/month cited most often | Companies with 10–50 employees | High (n=200+) |
| Top feature driver | Reporting and export cited by 61% | Power users (5+ sessions/week) | High (n=200+) |
| Main friction point | Onboarding complexity | New users (<30 days) | Medium (n=80+) |
| Unaided brand awareness | about one-fifth in target segment | Mid-market, U.S. only | Medium (n=150) |
For trend analysis and structured interpretation of secondary data, map findings against your primary data to check for consistency. When secondary data and primary data conflict, investigate before concluding.
Statistical concerns to flag: If your survey sample is under 100, treat percentage findings as directional, not definitive. If a subgroup analysis is based on fewer than 30 respondents, note it explicitly in your report. When findings will drive a pricing change or a major product investment, bring in a statistician or use a platform with built-in significance testing before presenting to the board.
Step 5: Report findings so stakeholders actually do something
A research report that does not produce a decision is a failed study, regardless of how good the data is. The goal of reporting is not to show everything you found. It is to make the decision obvious.
Structure your report around this outline:
- Executive summary (1 page): Decision context, three to five key findings, and the recommended action.
- Methodology (half page): Methods used, sample size and composition, fieldwork dates, and any limitations.
- Findings (3–8 pages): One section per research question, with supporting data, quotes, and visuals.
- Implications: What the findings mean for the decision, not just what the data says.
- Recommended actions: Specific, assigned, time-bound.
One-page action plan template
| Recommendation | Owner | Deadline | KPI |
|---|---|---|---|
| Launch $59/month tier to existing users | Product lead | 6 weeks | Upgrade rate among eligible users |
| Revise onboarding flow for new users | UX lead | 8 weeks | activation rate on day 6 |
| Run awareness campaign in mid-market segment | Marketing lead | 10 weeks | Unaided awareness in next quarterly survey |
For turning research into decisions that small teams can execute, the action plan is more important than the slide deck. Assign an owner and a deadline to every recommendation before the debrief meeting ends. Recommendations without owners are wishes.
When presenting to stakeholders, lead with the decision, not the methodology. Open with: “Based on this research, we recommend X. Here is why.” Then walk through the evidence. Decision-makers who have to sit through 20 minutes of methodology before hearing the point tend to disengage before you get there.
Step 6: Make research a habit, not a one-time event
One study answers one question at one point in time. Markets shift, customer needs evolve, and competitors move. Research treated as ongoing radar lets teams anticipate those shifts instead of reacting to them six months late.
Set a cadence:
- Weekly micro-tests: Monitor review sites, social listening, and support tickets for emerging language and complaints.
- Monthly discovery: One to three customer conversations to pressure-test current assumptions.
- Quarterly validation: A short survey (10–15 questions) to track key metrics: awareness, satisfaction, pricing sensitivity, and feature priority.
- Annual deep study: A full mixed-methods study to reset your understanding of the market and update your strategic plan.
Iteration checklist:
- Run a pilot study or small-batch test.
- Document what you learned and where the gaps are.
- Adjust your research questions and instruments.
- Retest with the updated design.
Knowledge management: Store research briefs, screeners, transcripts, and final reports in a shared folder structure that anyone on the team can search. Tag each document with the research question it addresses, the date, and the audience segment. A finding from eight months ago about pricing sensitivity is still useful context when you are designing next quarter’s study. Teams that do not store findings systematically repeat the same research every 18 months.
Scaling an insight program in an SME does not require a dedicated research team. It requires a documented cadence, a shared repository, and someone accountable for reviewing findings before each major decision.
Ready-to-use templates: brief, survey, interview guide, and scoring rubric
A focused research brief prevents scope creep and keeps studies on track. The brief is the single document that aligns the team before a single question is written or a single participant is recruited.
One-page research brief template
Decision: [One sentence: what will you do differently based on findings?]
Research questions: [List 3–5 specific, testable questions]
Methods: [e.g., 12 in-depth interviews + 200-person online survey]
Target audience: [Role, company size, geography, usage criteria]
Screener criteria: [3–5 qualifying questions]
Timeline: [Start date → fieldwork end → analysis → report]
Budget: [Incentives / software / analysis / total]
Success criteria: [What finding, at what threshold, triggers the recommended action?]
Sign-off: [Name and role of decision-maker]
Sample survey questions by objective
- Awareness: “Which of the following brands have you heard of?” (Aided list) / “Name any brands in [category] that come to mind.” (Unaided)
- Preference: “Which of these features would most influence your decision to switch providers?” (Select up to 3)
- Pricing: “At what monthly price does [product] start to feel like a good deal? At what price does it feel too expensive?”
- Satisfaction: “How satisfied are you with [product] overall?” (1–5 scale) / “What would make you more likely to renew?”
- Segmentation: “How many employees does your company have?” / “Which department owns this decision at your company?”
Interview guide: core probes
- “Describe the last time this problem cost you time or money. What happened?”
- “What solutions have you tried? What made you stop using them?”
- “If you had a magic fix for this problem, what would it look like?”
- “Who else is involved in this decision at your company?”
- “What would make you confident enough to switch?”
Qualitative theme scoring rubric
| Theme | Frequency (% of participants) | Intensity (1–5) | Strategic relevance (1–5) | Priority |
|---|---|---|---|---|
| Onboarding friction | just under three-quarters | 4 | 5 | High |
| Pricing transparency | a bit over half | 3 | 4 | High |
| Reporting depth | close to half | 4 | 3 | Medium |
| Mobile access | approximately a quarter | 2 | 2 | Low |
Score each theme on frequency, intensity (how strongly participants feel about it), and strategic relevance (how directly it connects to your decision). Themes that score high on all three deserve a recommendation. Themes that score high on frequency but low on strategic relevance are interesting but not urgent.
Common mistakes that kill good research before it starts
Most research failures are not data problems. They are design problems that show up before a single question is asked.
Top pitfalls:
- Vague objectives: “Understand our customers better” produces data nobody can act on. Every study needs a decision statement.
- Leading questions: “How much do you love our new feature?” is not a research question. It is a compliment-fishing exercise.
- Wrong sample: Surveying your most loyal customers about churn risk tells you nothing about why people leave.
- Single-method over-reliance: Twelve interviews are not a market. A 500-person survey with bad questions is not insight.
- Confirmation bias in analysis: Looking for data that supports the decision you already want to make. The fix is to write your analysis plan before you see the data.
Red-flag checklist before finalizing your study:
- [ ] Does every research question map to the decision statement?
- [ ] Are all survey questions neutral in wording?
- [ ] Does the sample reflect the audience you are actually trying to understand?
- [ ] Have you defined what a “significant” finding looks like before collecting data?
- [ ] Is there a plan for what happens if findings contradict the current strategy?
Red-flag checklist before presenting findings:
- [ ] Are recommendations tied to specific findings, not general impressions?
- [ ] Have you noted sample-size limitations for any subgroup analysis?
- [ ] Does the executive summary lead with the decision, not the methodology?
- [ ] Has someone who was not involved in the study reviewed the report for interpretation bias?
Pro Tip: Maintain internal independence. The person who designed the study should not be the sole person who interprets the findings. A 30-minute peer review of your analysis by someone unfamiliar with the project catches more errors than any statistical test.
Key Takeaways
Effective market research starts with a single, specific business decision and works backward to the minimum data needed to make it confidently.
| Point | Details |
|---|---|
| Start with the decision | Write a one-sentence decision statement before choosing any method or writing any question. |
| Use 3–5 research questions | Vague objectives produce unusable data; specific questions drive method selection and reporting. |
| Sequence your methods | Run secondary research first, then qualitative discovery (8–20 interviews), then quantitative validation. |
| Build a cadence | One-off studies go stale; weekly, monthly, and quarterly research rhythms keep strategy current. |
| Blue Prysm accelerates the cycle | Blue Prysm’s AI-powered research tools and real-time market analysis compress the gap between data collection and decision-ready insight. |
The part most market research guides won’t tell you
Most guides treat market research as a linear, tidy process. Define, plan, collect, analyze, report. In practice, it is messier and faster than that, especially for small teams making real decisions under time pressure.
The trap most founders fall into is not skipping research. It is over-engineering it. They spend three weeks designing the perfect survey instrument, recruit 300 respondents, and produce a 40-page report that arrives two weeks after the decision was already made. The research was technically sound. It was also useless.
The better mental model: research is a series of bets on where uncertainty is highest. You are not trying to eliminate uncertainty. You are trying to reduce it enough to act. That means starting with the fastest, cheapest method that gives you a directional answer, then escalating to more rigorous methods only if the stakes justify it. Ten customer conversations in a week will often tell you more than a month-long survey project, because the conversations surface the language, the emotion, and the context that no multiple-choice question can capture.
Where Agentic AI changes this calculus is in the logistics layer. Scheduling interviews, transcribing recordings, coding themes, and monitoring competitor reviews used to eat 40–60% of a study’s total time. Automated workflows handle most of that now, which means the human work shifts to the parts that actually require judgment: writing the right questions, probing the unexpected answer, and deciding which finding is worth acting on. The teams that use AI well are not replacing research judgment. They are buying back the time to exercise it.
One more thing: the research brief is not a formality. It is the most important document in the study. If you cannot write a clear brief, you are not ready to collect data. The brief forces you to articulate the decision, the audience, and the success criteria before you spend a dollar. Every hour spent sharpening the brief saves three hours in analysis and two rounds of stakeholder revision.
Blue Prysm turns your research into a living strategy, not a static report
Most research ends as a PDF in a shared drive. Blue Prysm is built for what happens next: taking validated findings and converting them into a strategy your team can track, update, and execute against in real time.
The Blue Prysm market analysis platform gives strategy and marketing leaders real-time market insights, automated competitive intelligence briefings, and a library of 50+ business frameworks to translate research findings into roadmaps and OKRs. Instead of running a study, writing a report, and watching it go stale, you connect your research outputs to live dashboards that flag when market conditions shift. For teams that run research on a quarterly cadence, that means your strategy stays current between studies, not just right after them.
The practical next step: start with a one-page research brief using the template above, run your first automated intelligence briefing through Blue Prysm, and see where your current assumptions diverge from live market data. That gap is usually where the most useful research questions are hiding.
Authoritative sources and further reading
The sources below support the frameworks, timelines, and templates in this guide. Federal sources are free and updated regularly; practitioner guides offer methodology depth.
-
U.S. Small Business Administration: Market Research and Competitive Analysis — The SBA’s practical guide for small businesses covers secondary sources, competitive analysis, and how to use research to reduce launch risk. Supports the overview, Step 2 budget guidance, and the secondary-research checklist.
-
U.S. Department of Commerce — Trade and industry data, sector reports, and economic indicators. Useful for market-sizing exercises and validating Total Addressable Market estimates.
-
U.S. International Trade Administration: Conducting Market Research — Step-by-step guidance on sizing markets and assessing competitive conditions, originally written for export research but applicable to domestic market analysis.
-
Blue Prysm: Market Research Tools — For teams that want to move from a one-off study to a continuous intelligence program, Blue Prysm’s AI-powered tools automate collection, synthesis, and competitive monitoring so research feeds strategy on an ongoing basis.
FAQ
What are the main steps in a market research process?
The core process runs six steps: define the decision and research questions, build the research plan (methods, sample, timeline, budget), collect data using secondary and primary methods, analyze and synthesize findings, report recommendations with assigned owners and KPIs, and institutionalize research into a recurring cadence.
How many interviews do you need for qualitative market research?
Qualitative discovery typically saturates between 8 and 20 interviews. Fewer than eight risks missing important themes; more than twenty, without changing your guide or audience segment, usually produces diminishing returns.
What is the difference between qualitative and quantitative market research?
Qualitative research (interviews, focus groups) answers why and how with small samples and rich context. Quantitative research (surveys, analytics) answers how many and how much with larger samples and statistical outputs. Mixed-method studies use qualitative work to generate hypotheses and quantitative work to validate them.
How long does a market research study take?
A small single-method study takes one to two weeks. A medium mixed-method study runs four to six weeks. A large multi-segment study with statistical validation can take up to three months, depending on recruitment complexity and analysis depth.
What does a market research brief include?
A focused research brief covers the decision statement, 3–5 research questions, chosen methods, target audience and screener criteria, timeline, budget, success criteria, and the name of the decision-maker who signs off on findings.